The Graph Controls panel is used the to navigate the graph and change its behavior and appearance. Although much of its functionality is also accessible from
within the menu bar, you may find that the Graph Controls panel provides
easier access to commonly used functions. This scrollable panel consists of a series of sub-panels, labeled Configuration, Appearance, Navigation, Graph Lines, and Windows and Panels. Each may be expanded or collapsed by clicking on its heading. The panels are described
below.
Configuration Panel
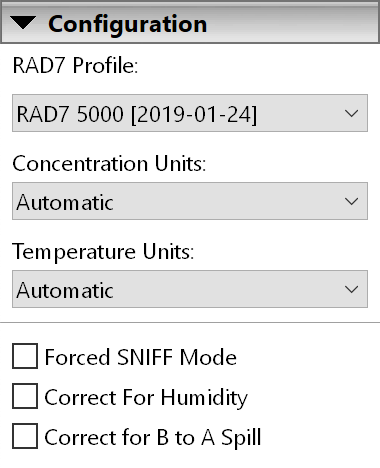
Figure 2: The Configuration Controls Panel
RAD7 Profile Pop-Up Menu
RAD7 Profiles contain sensitivity information and spill factor values that allow RAD7 data to be more accurately parsed and presented. CAPTURE maintains a collection of RAD7 Profiles, and they are created automatically as needed. When a RAD7 data file is opened, CAPTURE will select an appropriate profile, with respect to which RAD7 produced the data, and when the data was recorded. This selection may be overridden if desired using the RAD7 Profile pop-up menu. The collection of RAD7 Profiles may be edited in the Preferences Window, as described in the Preferences Window section.
Concentration Units Pop-Up Menu
Determines the unit of measurement used to denote radon and thoron concentrations
on the graph. The available options include Automatic, Bq/L, Bq/m3, dpm/L,
and pCi/L. The Automatic option causes radon and thoron concentrations to be presented
in the unit in which they were originally recorded inside the RAD7.
Temperature Units Pop-Up Menu
Determines the unit of measurement used to denote air and water temperatures
on the graph. The available options include Automatic, Celsius, Fahrenheit, and Kelvin. The Automatic option causes temperatures to be presented
in the unit in which they were originally recorded inside the RAD7.
Forced SNIFF Mode Checkbox
Determines whether the graph data is forced to be displayed as if it was recorded in SNIFF Mode. This checkbox is enabled whenever there exists at least one record that truly was recorded in SNIFF Mode. Such records are analyzed to determine the necessary SNIFF sensitivity data.
Correct For Humidity Checkbox
Determines whether the graph data is corrected for humidity. When relative humidity is high, radon concentration values are often underreported. Humidity correction compensates for this.
Correct for B to A Spill Checkbox
Determines whether correction is applied based on the spill from the B to A windows. Significant spill occurs when the thoron concentration is high relative to the radon concentration. Under these conditions it is recommended that the data be corrected to compensate.
Appearance Panel
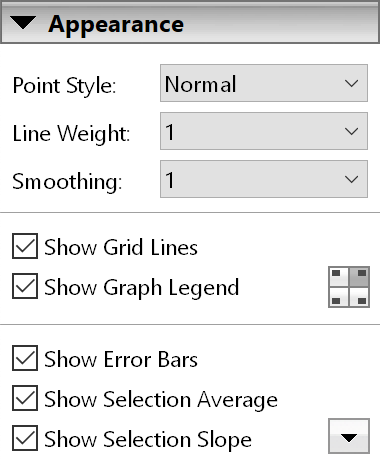
Figure 3: The Appearance Controls Panel
Point Style Pop-Up Menu
Determines the appearance of the data points on the graph. The options are Normal, Shapes, B&W (Black and White) Shapes, and Hidden. The B&W Shapes option causes the graph to be rendered in black and white, which is useful when graph image is printed on a non-color printer.
Line Weight Pop-Up Menu
Determines the thickness of the graph lines, as measured in pixels. This
value may range from 1 to 4, or the graph lines may be hidden. A thicker line may be easier to read, but
is somewhat less precise than a single-pixel line.
Smoothing Pop-Up Menu
Determines the degree of smoothing applied to the graph line. This
value may range from 1 (no smoothing) to 9 (high smoothing). When the degree
of smoothing is greater than 1, the original, non-smoothed graph line appears
faded in the background.
Show Grid Lines Checkbox
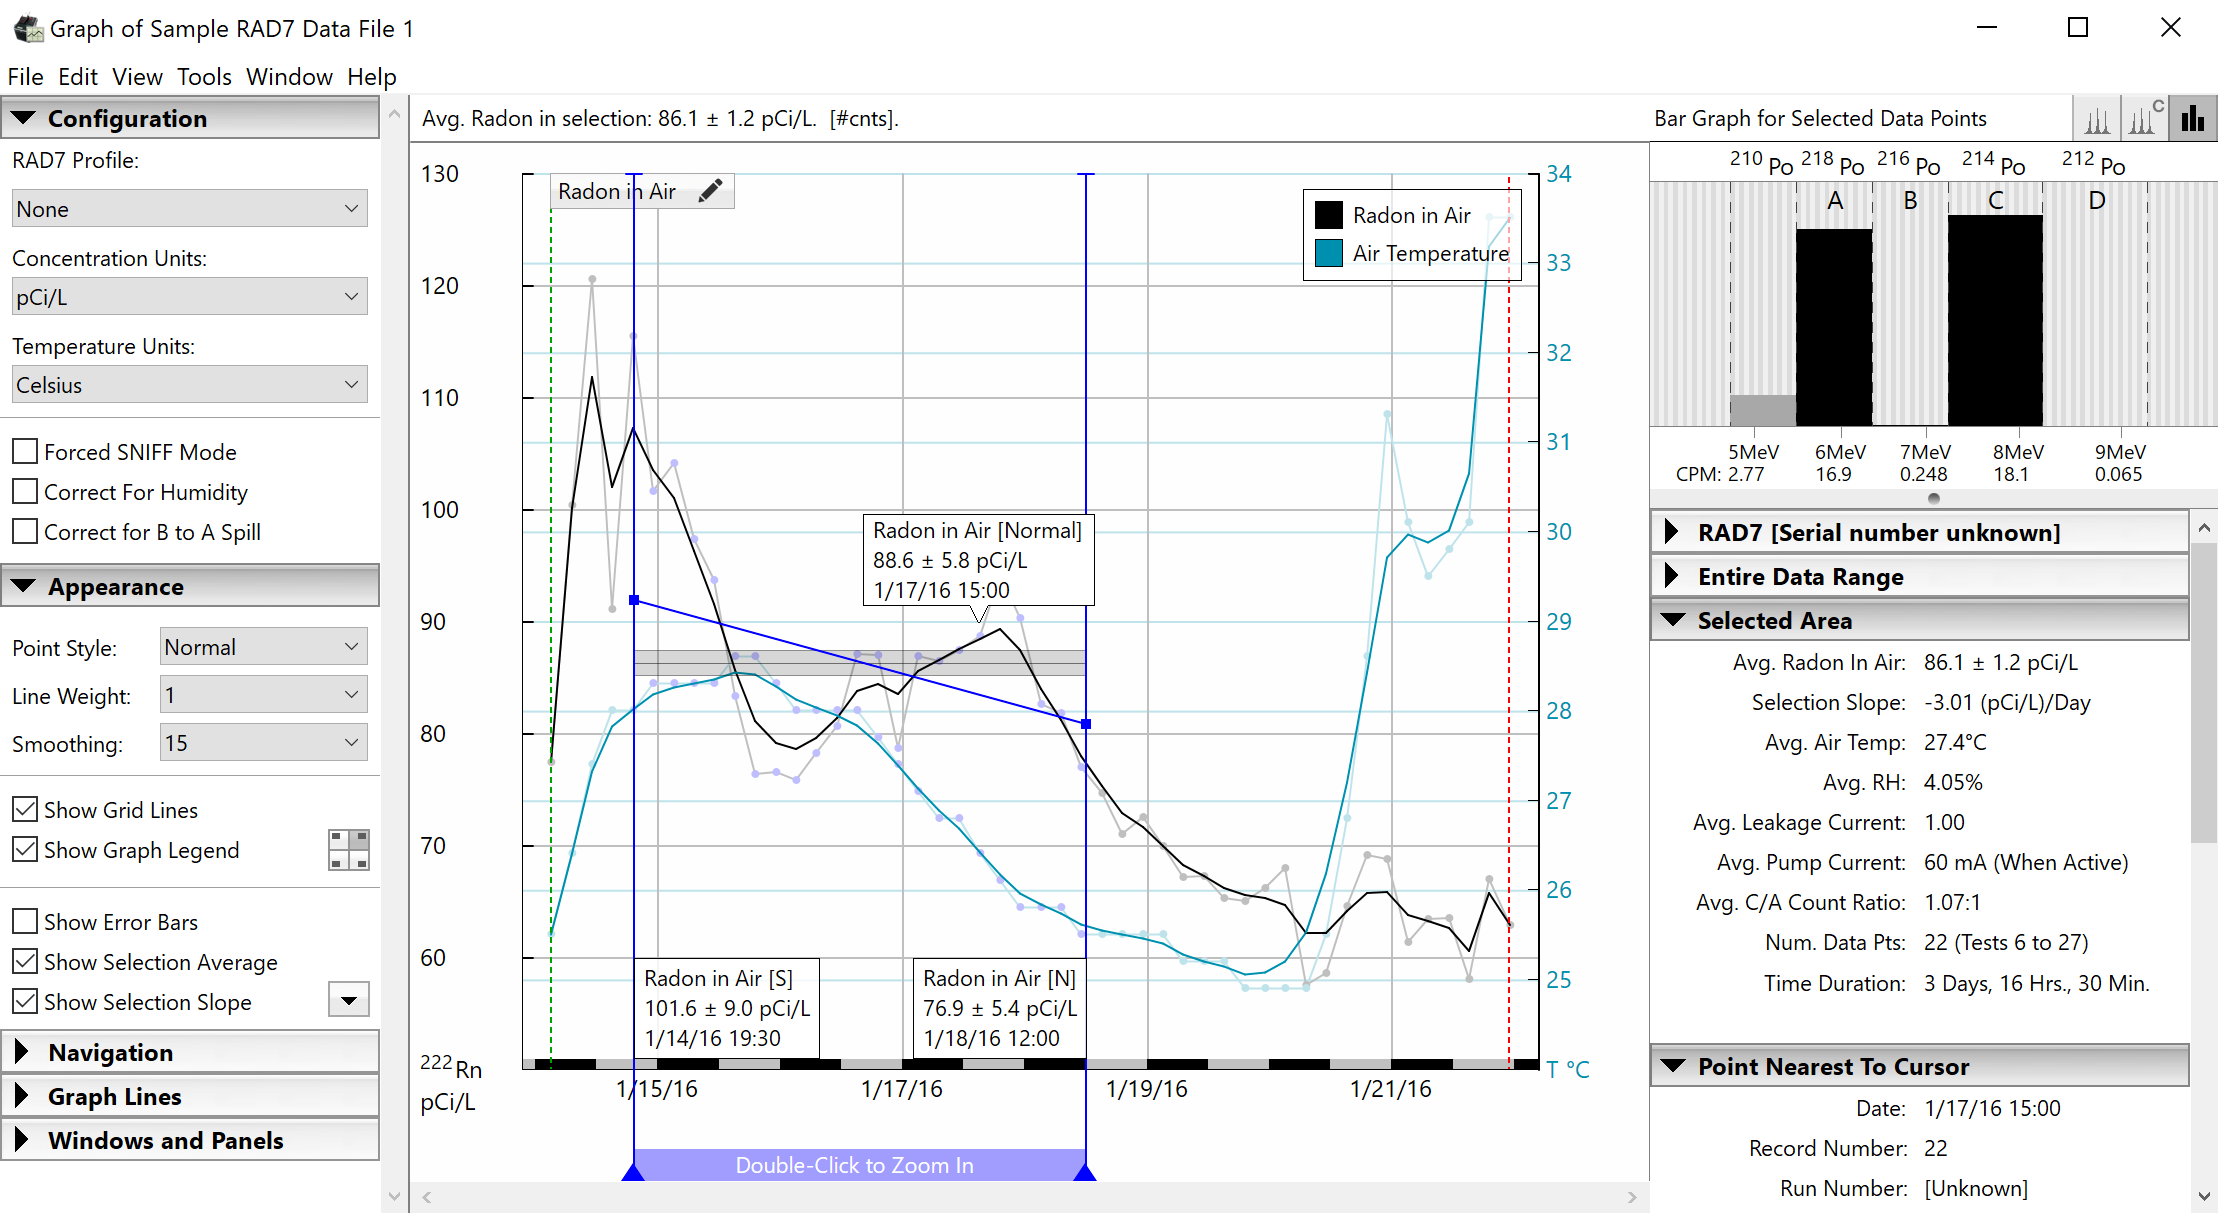
Determines whether horizontal and vertical grid lines are visible on the background of the graph. Grid lines are drawn at regular intervals, with vertical lines representing time intervals, and horizontal lines representing concentrations, temperatures, and humidity levels.
Show Graph Legend Checkbox
Determines whether the legend is visible on the Graph Window. The legend indicates
the significance of the colors that appear on the graph. To the right of the Show Graph Legend Checkbox is a small control for setting the position of the Graph Legend. It may be placed in any of the four corners of the graph image.
Show Error Bars Checkbox
Determines whether error bars are visible on the graph. Error bars are vertical line segments which pass through data points, indicating the uncertainty of radon and thoron readings.
Show Selection Average Checkbox
Determines whether a representation of the average of the selection is displayed between the Selection Bars. A horizontal line represents the average of the selection, and a shaded region represents the uncertainty of the average. Separate representations appear for Radon, Thoron, Radon in Water, and Thoron in Water.
Show Selection Slope Checkbox
Determines whether the Selection Slope Line is visible on the graph. This checkbox may be checked or unchecked, or it may be set to an intermediate partially checked state, in which case the Selection Slope Line only appears if the selection contains a series of fairly evenly distributed data points. The Selection Slope Line starts at the first Selection Bar and ends at the second Selection Bar. The default angle of the Selection Slope Line is based on a linear regression formula accounting for the distribution of the selected data points. However the line's endpoints may be dragged manually to modify the position and angle of the line if desired. If the line is adjusted manually, it will change from blue to red to indicate that a modification was made. The line's slope is stated in the Statistics panel, where it is expressed as a change in radon or thoron concentration per unit of time. The pop-up menu control to the right of the Show Selection Slope Checkbox is used to specify the time unit used in this expression. The time unit may be set to either Automatic, Months, Days, Hours, Minutes, or Seconds.
Navigation Panel
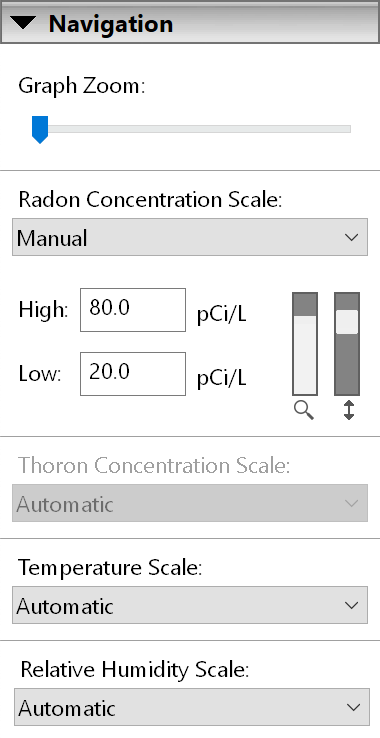
Figure 4: The Navigation Controls Panel
Graph Zoom Slider
Zooms the radon graph in and out. When this slider is dragged all the way to
the left, the entire collection of data is made visible, and no horizontal scrolling is required to see data points.
Scale Pop-Up Menus
The Radon Concentration Scale pop-up menu determines whether the Y scale of the radon graph is determined automatically or manually. If Automatic is selected, the graph's Y scale will be configured such that the visible radon points will occupy the entire available vertical space. Selecting Manual makes it possible to control the Y scale region yourself.
Also appearing in the Navigation panel are pop-up menus for specifying the Thoron Concentration Scale, the Temperature Scale, and the Relative Humidity scale. Each behaves similarly to the Radon Concentration Scale pop-up menu, and may be set to either Automatic or Manual.
Concentration Scale High and Low Fields
When a Scale pop-up menu is set to Manual, a set of controls for specifying the scale parameters appears. The High and Low fields represent the highest and lowest element values visible on the graph respectively. Separate sets of High and Low fields are present for radon, thoron, temperature, and relative humidity.
Concentration Zoom and Scroll Sliders
To the right of each pair of High and Low fields are a set of controls for zooming and scrolling the graph's Y Scale. The Zoom Slider, on the left, is controlled by clicking or dragging the filled region to the desired level; higher levels represent increased zoom. The Scroll Slider, on the right, operates like any scroll bar; simply drag the box up or down until the desired region scrolls into view. The height of the scroll box is proportional to the scope of the currently visible region. As with the High and Low fields, separate sets of Zoom and Scroll sliders are present for radon, thoron, temperature, and relative humidity.
Graph Lines Panel
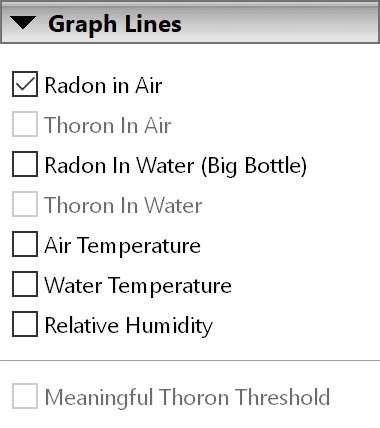
Figure 5: The Graph Lines Controls Panel
Radon Checkbox
Determines whether radon data is shown on the graph. The values of the radon data points may be affected by any corrections applied in the Configuration panel, as described above.
Thoron Checkbox
Determines whether Thoron data is shown on the graph. When displaying thoron for the first time, a dialog box may appear entitled "RAD7 Profile: Thoron Settings", where you will be
prompted to enter Thoron calibration values for the current graphing
session. If you are graphing data for the first time, and are simply
learning how to use the program, it is OK to accept the suggested default
values. However we urge you to contact DURRIDGE Company to receive the
optimal Thoron calibration values consistent with the serial number of
your specific RAD7 device. Once
these values are known, a series of RAD7 Profiles may be established, as described in the Preferences
Window section.
If Thoron data does not
appear when this box is checked, a button labeled "Thoron Details" will appear
at the upper right corner of the Graph Window. Clicking this button will provide
an explanation as to exactly why Thoron is not visible, and the option
to display Thoron anyway will be made available.
Radon In Water Checkbox
Determines whether radon in water data is shown on the graph. This checkbox is only enabled if a temperature data file containing water temperature information has been loaded along with the basic RAD7 data. This is because it is impossible to determine how much radon is in water without knowing the water's temperature.
Thoron In Water Checkbox
Determines whether thoron in water data is shown on the graph. As with the Show Thoron checkbox, clicking this box may result in the "RAD7 Profile: Thoron Settings" dialog or "Thoron Details" button appearing. As with the Radon In Water checkbox, this box is only enabled if a temperature data file containing water temperature information has been loaded along with the basic RAD7 data.
Air Temperature Checkbox
Determines whether air temperature data points are visible on the graph. The temperature unit used here may be set in the Configuration panel, as described above.
Water Temperature Checkbox
Determines whether water temperature data is visible on the graph. As with the Radon In Water checkbox, this box is only enabled if a temperature data file containing water temperature information has been loaded along with the basic RAD7 data.
Relative Humidity Checkbox
Determines whether relative humidity data is visible on the graph. Relative humidity values are stored as whole integers. Areas of excessive humidity will be identified with a differently colored radon graph line.
Meaningful Thoron Threshold Checkbox
Determines whether a shaded area will appear representing the area outside the meaningful thoron concentration range. A thoron reading may only be considered meaningful if the data point appears above this shaded area. If one or more thoron data points are found to be under the minimum concentration threshold, a dialog box will appear explaining the situation. Non-meaningful thoron data has high uncertainty, resulting from excessive spill between the RAD7's C and B windows. The Meaningful Thoron Threshold checkbox is only enabled if Thoron or Thoron in Water points are being displayed on the graph. If both Thoron and Thoron in Water points are visible, two shaded regions will be rendered.
Windows and Panels
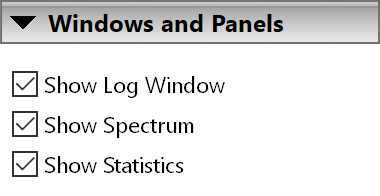
Figure 6: The Windows and Panels Controls Panel
Show Log Window Checkbox
Determines whether the Log Window is visible. This window contains a listing
of all of the actions that CAPTURE has performed since
the application was launched, plus a record of the data that has arrived through each serial port.
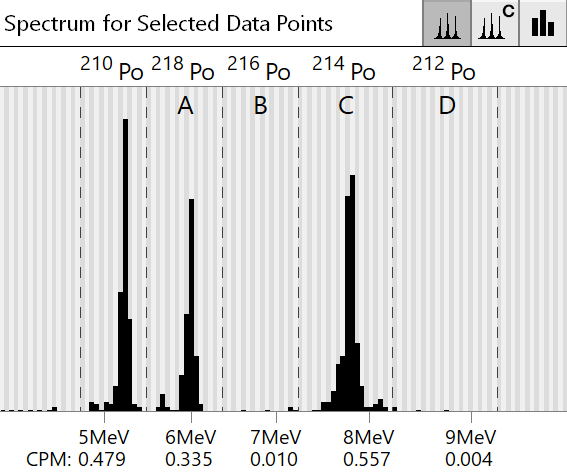
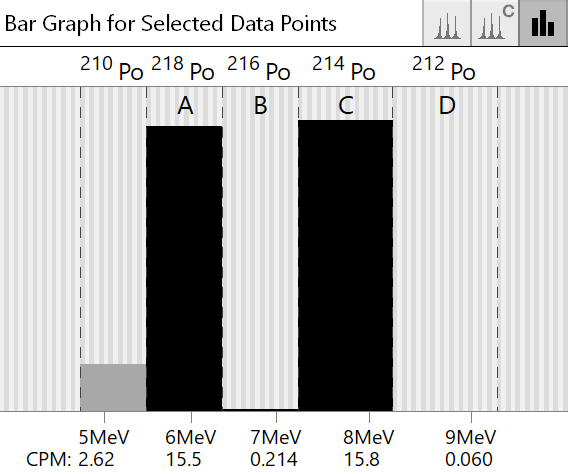
Show Spectrum
Determines whether the Spectrum panel is visible. This panel displays a graph
emulating the spectrum printed out by the RAD7.
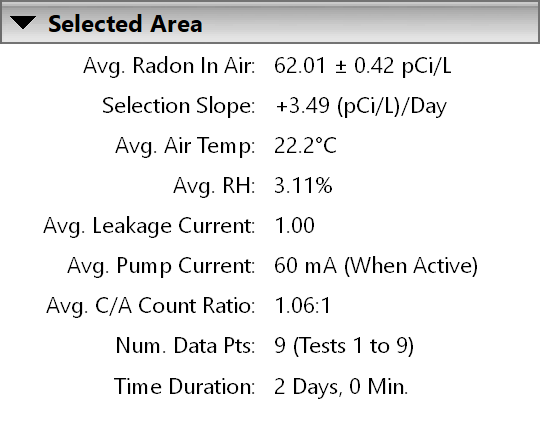
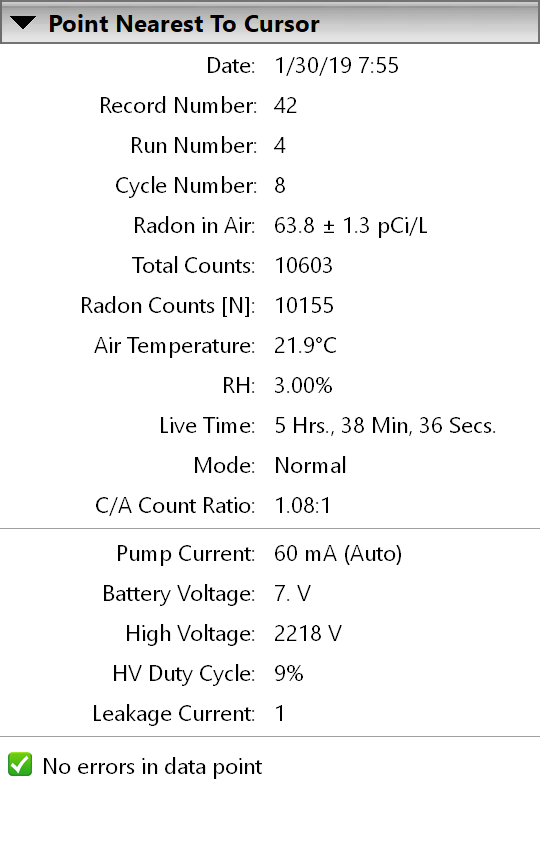
Show Statistics
Determines whether the Statistics panel is visible. This panel displays
a range of information on the data being displayed on the graph, as well
as whichever data lies within the selected portion of the graph.
|