 Figure 1: Export Selected Data options in the File menu.
|
DATA EXPORT, REPORTS, AND PRINTING |
|
The File menu contains commands for exporting RAD7 Data in various formats, generating several different kinds of reports, and for printing RAD7 data graphs. These features are detailed in this section. |
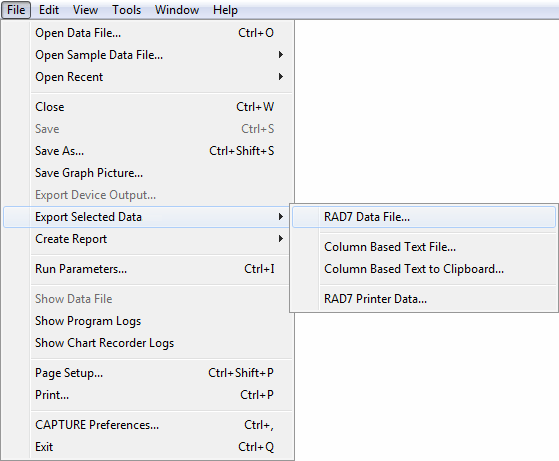
After RAD7 Data has been downloaded or opened from disk and made visible in a graph window, it may be exported in any of several formats. The Export Selected Data command in the File menu includes options for exporting different types of files, as described below. Most of these will involve only the selected records, which are those found between the two Selection Bars. More information on using the Selection Bars is available in the Graph Navigation section. |
|
|
Figure 1: Export Selected Data options in the File menu. |
|
Exporting RAD7 Data Files The RAD7 Data File submenu command exports a R7CDT or R7RAW Data File containing only the data that is selected on the graph. The exported file will contain only valid data, and will therefore not produce any fatal error messages when opened for graphing. Choosing the RAD7 Data File option will present a Save As dialog box, in which the name and location of the exported file may be specified, as well as the file type. Two file type options may be offered: "RAD7 Data File (With Supplemental Data)", and "RAD7 Data File (Without Supplemental Data)". The first option produces a R7CDT file which contains not only the radon data, but also information about the RAD7 from which the data came, as well as information on thoron concentrations and record run numbers. The second option produces a simpler R7RAW file, which contains only radon data. Such files adhere to the format seen when downloading data using the RAD7's "Data Com" or "Special ComAll" commands. This format is fully documented in the RAD7 manual, and may be preferable if the output is intended for use with third party applications or custom tools. Note that if the original data set does not contain information on the RAD7 from which it came, the option to include supplemental data will not be offered and the result will be a R7RAW file. More information on the R7RAW and R7CDT file formats is available in the File Formats section. |
|
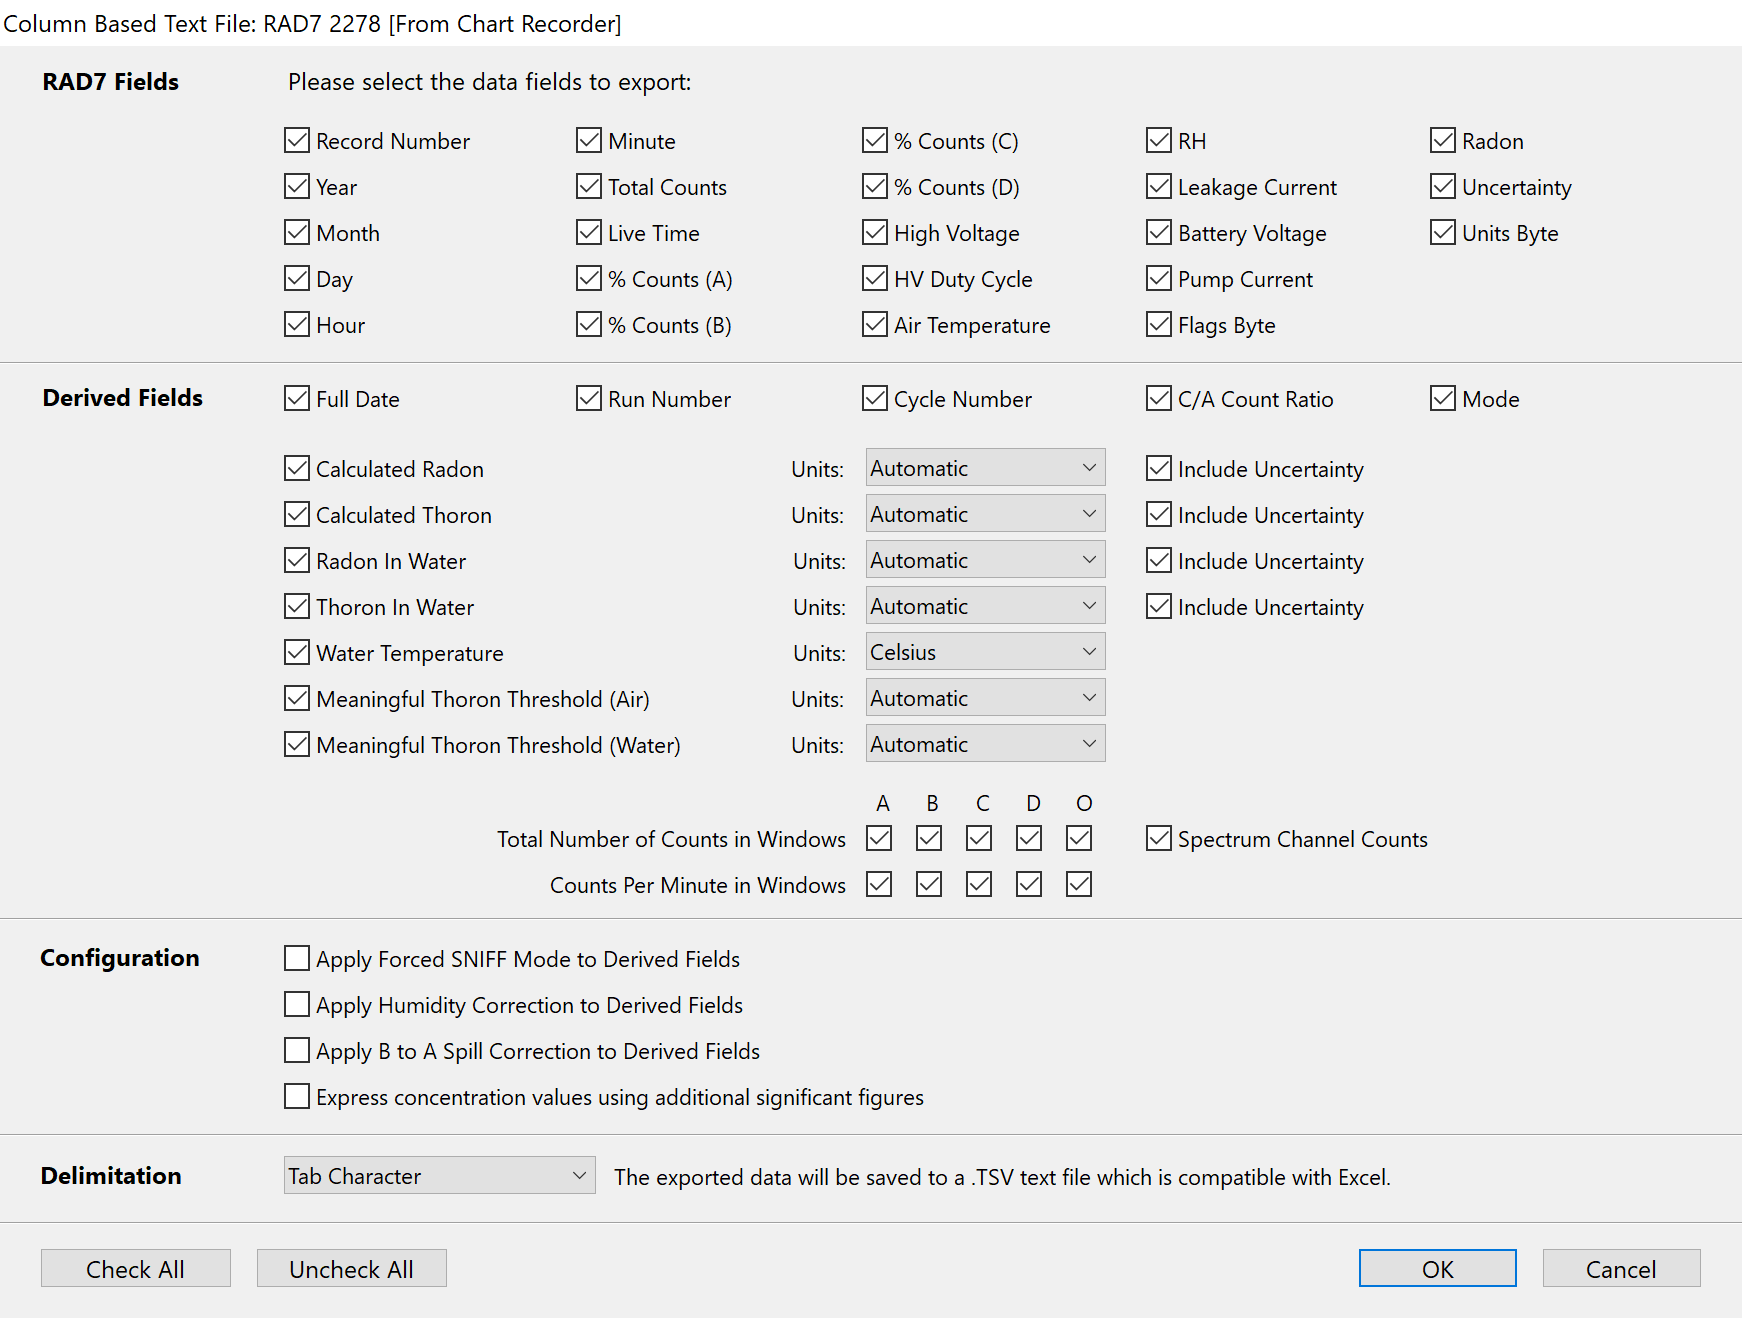
Exporting Column Based Data The Export Selected Data command produces a submenu containing two related commands: Column Based Text File, and Column Based Text to Clipboard. These submenu commands produce textual data in a format suitable for importing into Microsoft Excel and other spreadsheet applications. The Column Based Text File command saves the data to a plain text file with the .csv or .tsv file name extension (indicating "Comma Separated Values" or "Tab Separated Values"), while the Column Based Text to Clipboard command simply copies the information to the clipboard, making it possible to paste it into another program. Both of these operations bring up the Export Column Based Text Window, which is shown in Figure 2, below. This window is used for specifying the desired fields for inclusion in the exported data. Each included field is exported as a separate column of tab- or comma-delimited text. The details of this window are explained below. |
|
The checkboxes in the section of the window labeled Configuration are used to specify whether Forced SNIFF Mode, Humidity Correction, and/or B to A Spill Correction are applied to any derived data that is being exported. If the "Express concentration values using additional significant figures checkbox" is checked, the exported concentration values will be expressed using much greater precision than normal. In most cases this added precision is not useful, due to the considerable uncertainty inherent in each concentration measurement. The Delimitation pop-up menu is used to specify whether the columns of text will be separated by commas or tab characters. The appropriate choice here will depend on the requirements of the program in which the exported data will be viewed. Selecting Tab Character here will produce a plain text file with a .tsv file name extension. The Comma Character option produces a plain text file with a .csv file name extension. Both of these file types can be directly opened in Microsoft Excel. Once the desired selections have been made, click the OK button. If a column-based text file is being produced, the Save As dialog box will appear, where a name and location may be chosen for the exported file. Note that although this data can be imported into a spreadsheet application or opened in a word processing application, the data will not be able to be re-imported into CAPTURE. |
|
Exporting RAD7 Printer Data The Export RAD7 Printer Data command saves a textual Printer Data file, containing the supplementary printed information associated with each RAD7 record. This information is not available for all data sets. Choosing this option will present a Save As dialog box, in which the name and location of the exported file may be specified. |
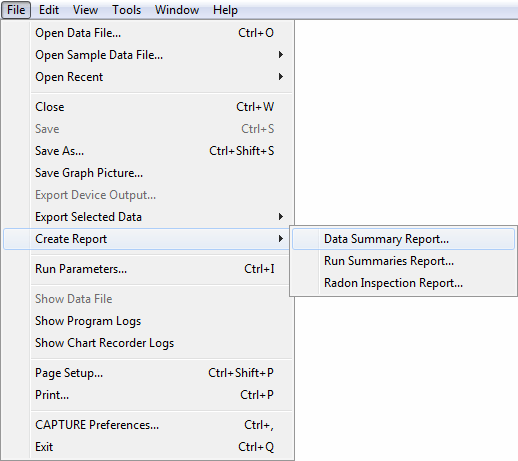
When RAD7 Data is visible in a graph window, it is possible to create several different kinds of reports using a submenu under the File Menu's Create Report command. The report options are described below. |
|
|
|
|
Creating a Data Summary Report The Data Summary Report command creates a textual Data Summary file, containing basic information about the selected records and the RAD7 used to record them. Choosing this option and clicking Next will present a Save As dialog box, in which the name and location of the exported file may be specified. A sample Data Summary file is shown in Figure 4, below. 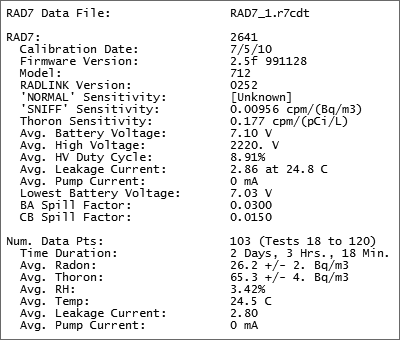 Figure 4: Sample Data Summary file |
|
Creating a Run Summaries Report The Run Summaries Report command creates a text-based Run Summaries file containing information on each run, as shown in Figure 5. Choosing this option will present the Run Summaries window, as shown in Figure 6. This is used to specify the types of data included in the Run Summaries file, plus any corrections applied to the data, and the formatting of the columns in the file. Each of these parameters is explained below. |
|
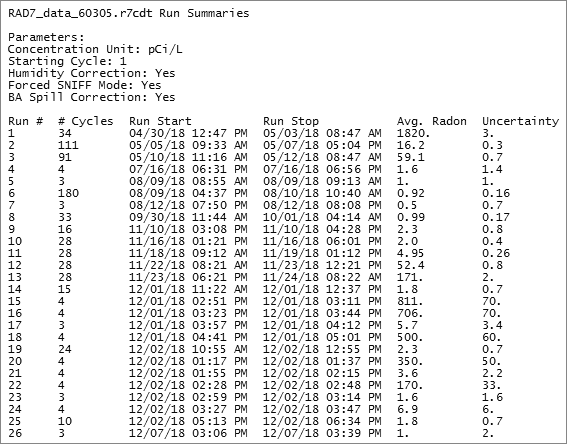 Figure 5: Sample Run Summaries file with text formatted for print output. Figure 5: Sample Run Summaries file with text formatted for print output.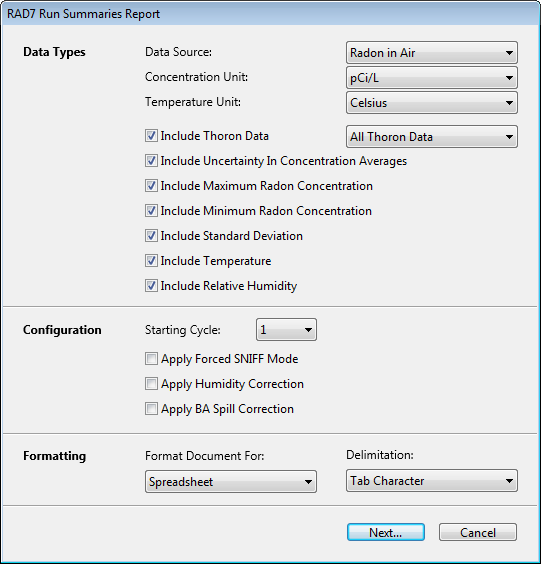 Figure 6: Export Run Summaries Window Figure 6: Export Run Summaries Window |
The Data Source pop-up menu is used to specify the source of the concentration averages included in the Run Summaries file. This may be set to either Radon in Air or Radon in Water. The Concentration Unit pop-up menu is used to specify the concentration unit used to express concentration averages in the file. This may be set to Bq/L, Bq/m³, dpm/L, or pCi/L. The Temperature Unit pop-up menu is used to specify the unit of the temperature averages in the file. This may be set to Celsius or Fahrenheit. The Include Thoron Data checkbox controls whether the Run Summaries file will contain columns listing thoron concentration averages, in addition to radon concentration averages for each run. The accompanying pop-up menu is used to specify whether all thoron readings are taken into account when calculating the average, or only valid thoron readings. For a thoron reading to be considered valid, the RAD7 pump must be running continuously, or the RAD7 must have been operating in Thoron mode. (Thoron mode can be enabled from within the RAD7's Data menu.) The Include Uncertainty in Concentration Averages checkbox controls whether the uncertainty of the concentration averages for each run are included in the file. The average uncertainty for a run is typically much lower than the concentration uncertainty for any given cycle within the run. The Include Maximum Radon Concentration and Include Minimum Radon Concentration checkboxes control whether the respective maximum and minimum radon values present in each run are reported in the file. The Include Standard Deviation checkbox controls whether the standard deviation of the concentrations within each run are included in the file. The Standard Deviation value indicates the amount of variation in the recorded radon concentrations within a run. Note that this deviation can be due to both statistical error and actual changes in the radon concentration. The Include Temperature and Include Humidity checkboxes control whether the average temperature and relative humidity of each run are included in the file, respectively. The Starting Cycle pop-up menu is used to specify the first cycle from each run that is included in calculated averages. For example, if this menu is set to 3, then the reported concentration average for a run containing ten cycles would be calculated based on runs 3 through 10. This is useful if the radon levels reported for the initial cycles are not representative of the full run. The Apply Humidity Correction, Apply Forced SNIFF Mode, and Apply BA Spill Correction checkboxes determine which correction(s) are applied to the concentration averages reported in the Run Summaries file. Similar controls are found in the Graph Controls panel, and more information about corrections can be found in the Graph Controls Panel section. The Format Document For pop-up menu has two options, Print and Spreadsheet. If Print is selected, the document will be laid out in an easy to read format, as shown in Figure 5, above. The Spreadsheet option produces a file that is not as easily readable, but better suited for data analysis applications. If this option is selected, the Delimitation pop-up menu appears, making it possible to specify whether the document's columns will be separated by commas or tab characters. |
|
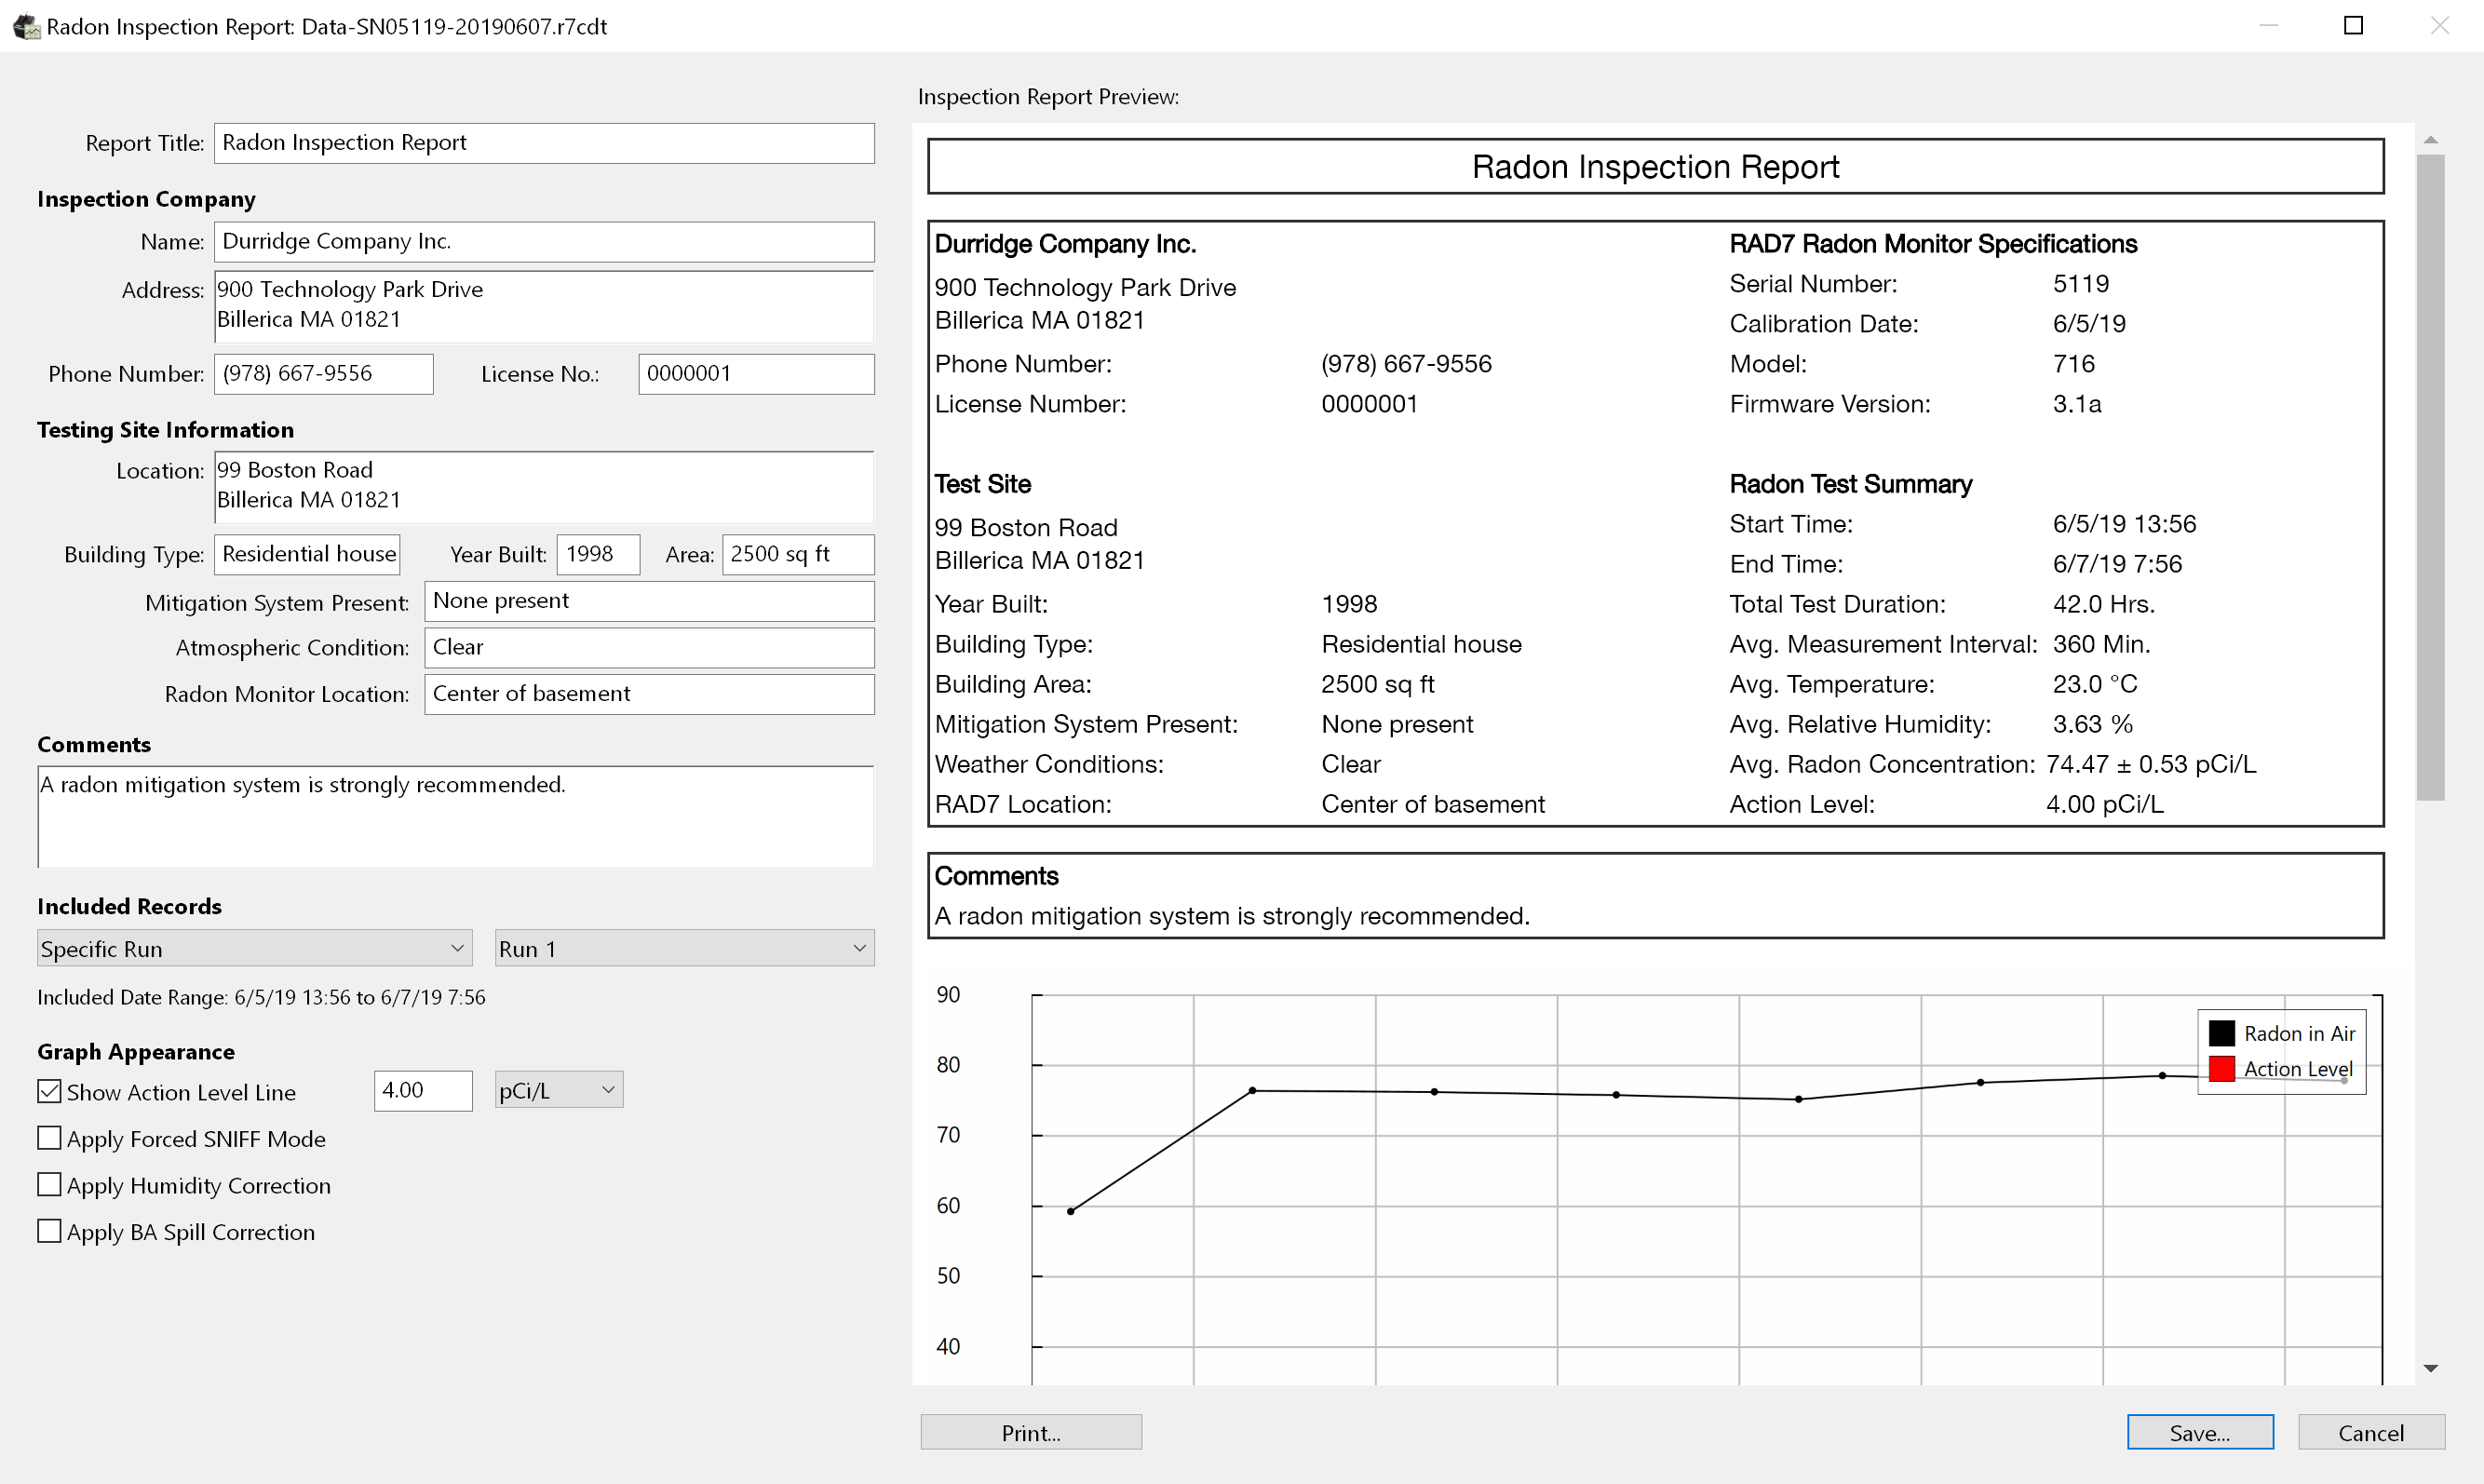
Creating a Radon Inspection Report The Radon Inspection Report command produces an HTML-based radon inspection report. The report includes a data summary, a high resolution graph image, and a table containing complete experimental results. The graph image is embedded inside the HTML document, making it a single portable file that can be viewed in any web browser. Choosing the Export Radon Inspection Report command brings up the window pictured below. This window is used to specify the report parameters, including the name and address of the radon testing firm, the details of the property being tested, which data records are included in the report, and whether the Action Level is represented on the graph. If the Show Action Level Line checkbox is checked, a red line will be drawn horizontally across the graph indicating the radon concentration threshold at which a mitigation system is recommended. (The line color can be changed in the Preferences Window.) Checkboxes are also provided for specifying whether Forced SNIFF Mode, Humidity Correction, and BA Spill Correction are applied to the inspection report data. Other parameters, such as whether the temperature and humidity graph lines are visible, the thickness of the graph lines, and the radon concentration unit used on the graph, are based on the configuration of the associated graph window. Once the necessary information has been entered, click the Next... button and specify a name and location for the report. After the report has been generated, it will automatically open in a web browser window. From there it may be printed or exported as a PDF (provided the browser's Print command facilitates printing documents to the PDF format). |
When a Graph Window is visible, the radon graph can be printed at high resolution. CAPTURE's print commands are located in the File menu. The Print command prints the current radon graph. On some systems, the Print dialog box may also be used to save, fax, or email a cross-platform PDF version of the graph image. The keyboard shortcut for this operation is Control-P on Windows, and Command-P on macOS. The Image Output panel in the Preferences Window may be used to specify whether the selected region appears on the printout, and whether statistics will be included on the printout. The File Menu's Page Setup command is used to configure the page orientation and other print settings. The Portrait orientation option places the graph on the top of the page, with graph statistics optionally appearing below the graph image. The Landscape orientation option rotates the graph image, allowing it to fill the entire sheet. When the Landscape option is selected, graph statistics are displayed on a second page. Use the keyboard shortcut Control-Shift-P (Windows) or Command-Shift-P (macOS) to bring up the Page Setup dialog. |
|