THE PREFERENCES WINDOW


Many important configuration options are made available in the CAPTURE Preferences Window. This window is accessed from the File Menu on Windows, and from the Application Menu on the macOS. Alternatively, you can bring up the Preferences Window with the command-comma keyboard shortcut on Windows, or with the control-comma shortcut on macOS. The Preferences window consists of multiple panels, the contents of which are described below.

General Panel 

The General panel contains controls for specifying how CAPTURE behaves when connecting to RAD7s, downloading RAD7 data, and formatting the downloaded information. These controls are described in detail below.


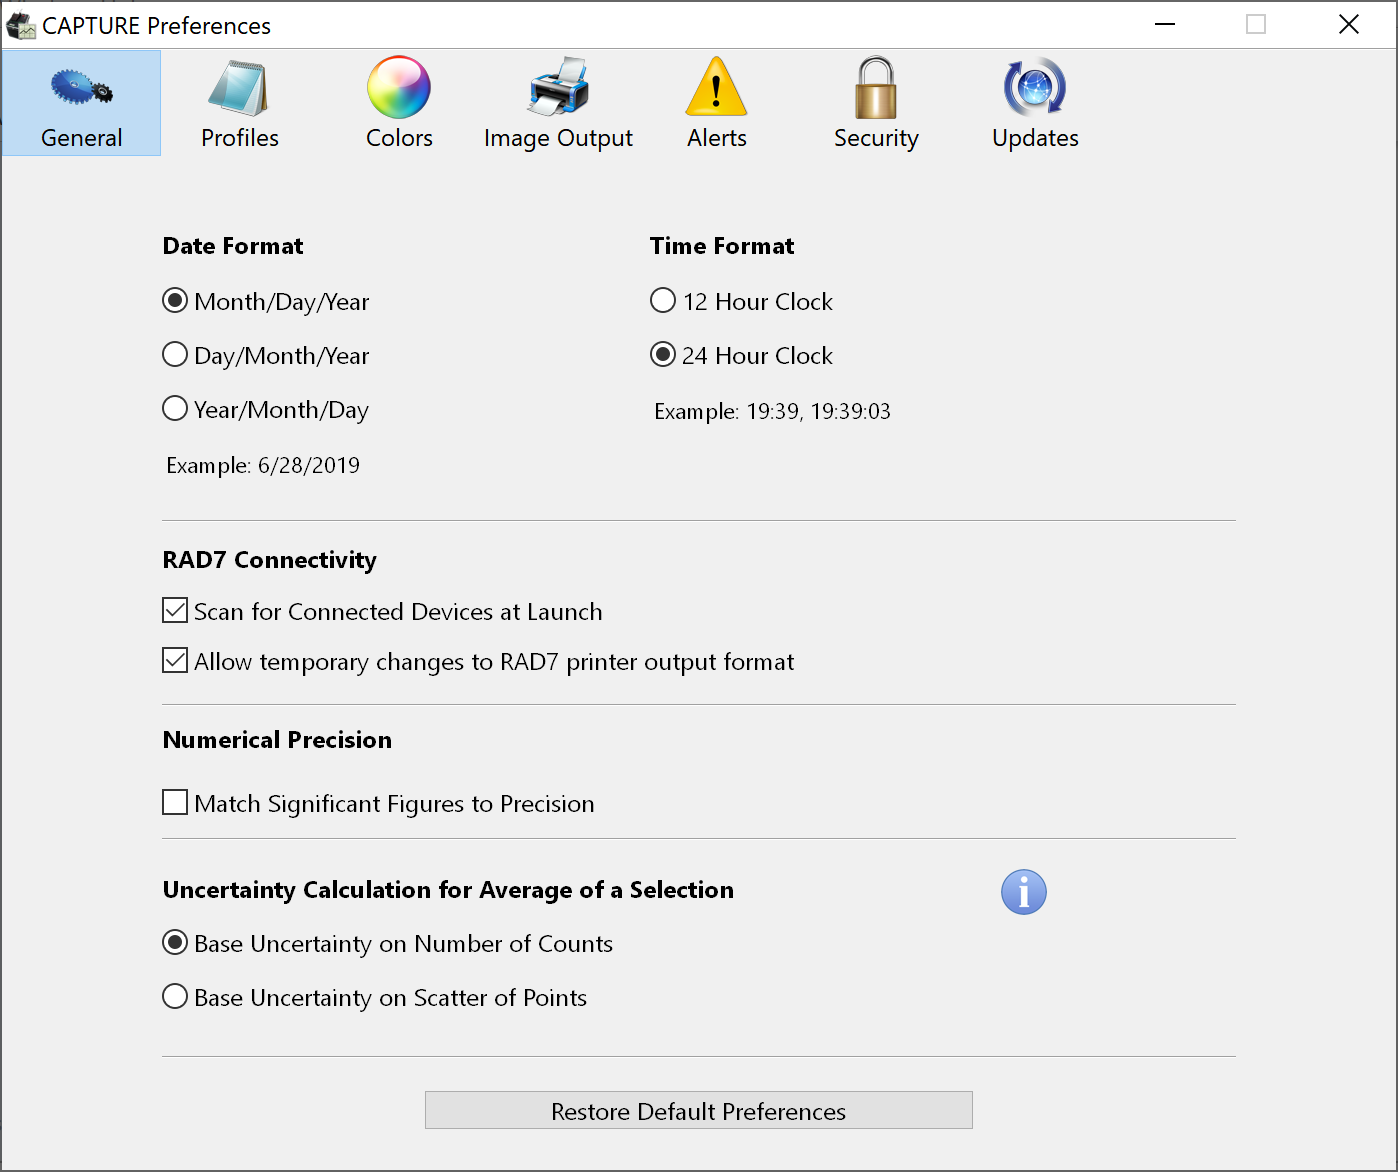
Figure 1: The General Preferences Panel.


Date Format

The radio buttons in the Date Format section is used to specify the format used to display dates throughout the application. Dates may be displayed with the year, month, and day figures ordered in any of three different arrangements.


Time Format

The radio buttons in the Time Format section is used to specify the format used to display times throughout the application. Times may be displayed in either a 12-hour or 24 hour format.


RAD7 Connectivity

The Scan for Connected RAD7s at Launch checkbox in the RAD7 Connectivity section is used to specify whether CAPTURE identifies all connected RAD7s when it starts up. If this box is left unchecked, it will be necessary to click the Scan For RAD7s button in the Main Window before performing an automatic download or issuing or relaying RAD7 commands.

The Allow Changes to RAD7 Output Format checkbox determines whether CAPTURE is permitted to change the format of the RAD7's output in an effort to improve communication performance. This option is most beneficial when downloading large numbers of records. If this box is checked, CAPTURE will attempt to restore the RAD7 to its previous output format after each communication is complete.


Precision

The Match Significant Figures to Precision checkbox is used to specify whether radon and thoron concentrations are expressed using fewer significant digits when the associated uncertainties are high. If this box is checked, an uncertainty greater than 150% of the base value will cause the concentration to be expressed using only one significant digit; an uncertainty greater than 15% of the base value will cause the concentration to be expressed using two significant digits; an uncertainty greater than 1.5% of the base value will cause the concentration to be expressed using three significant digits; and so on.

Normally uncertainties are expressed using two significant digits, and base concentrations are always expressed using the same number of digits to the right of the decimal point as in the uncertainty value.


Uncertainty Calculation

There are two Uncertainty Calculation options: Base Uncertainty on Number of Counts, and Base Uncertainty on Scatter of Points. Basing the uncertainty on the Number of Counts involves Poisson statistics, and is applicable even when there is a significant variation in radon concentration during the period of the measurement. Basing the uncertainty on the Scatter of Points is applicable when there are more than ten readings and it is known that the radon concentration was steady during the period selected.

Please note that the uncertainty, as displayed, refers only to the statistical uncertainty of the result. This is a measure of the precision of the reading. The result ignores any systematic bias due to uncertainty in the calibration, and traceability to national standards, which may be as much as ±5%.


Profiles Panel

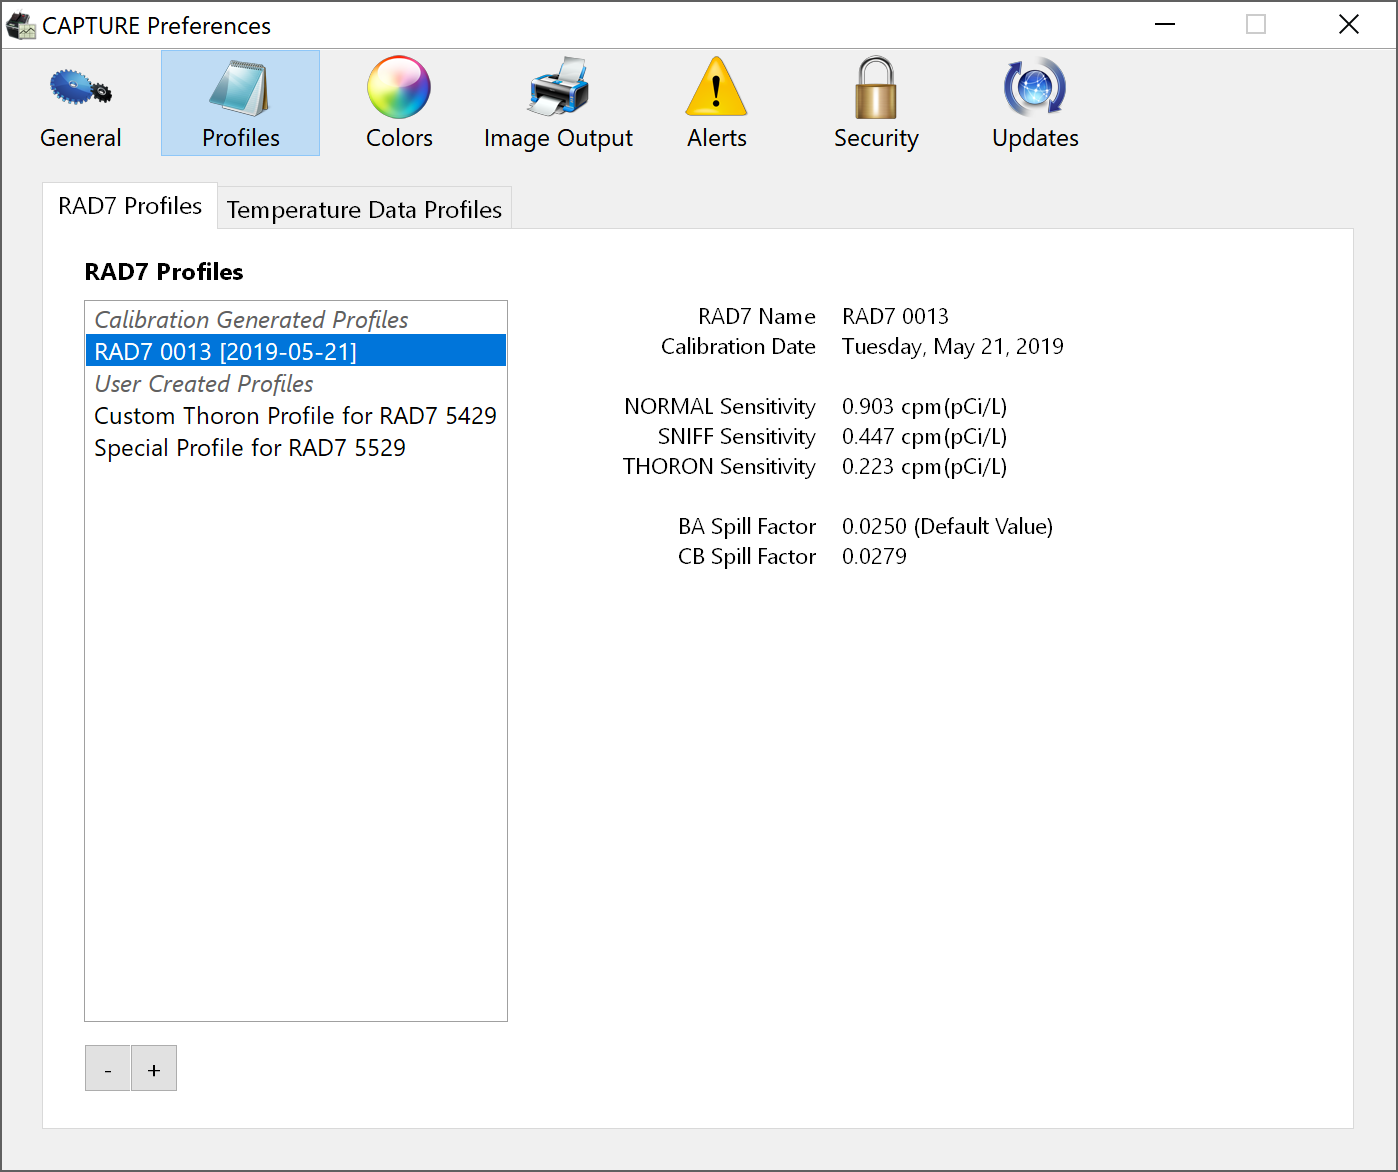
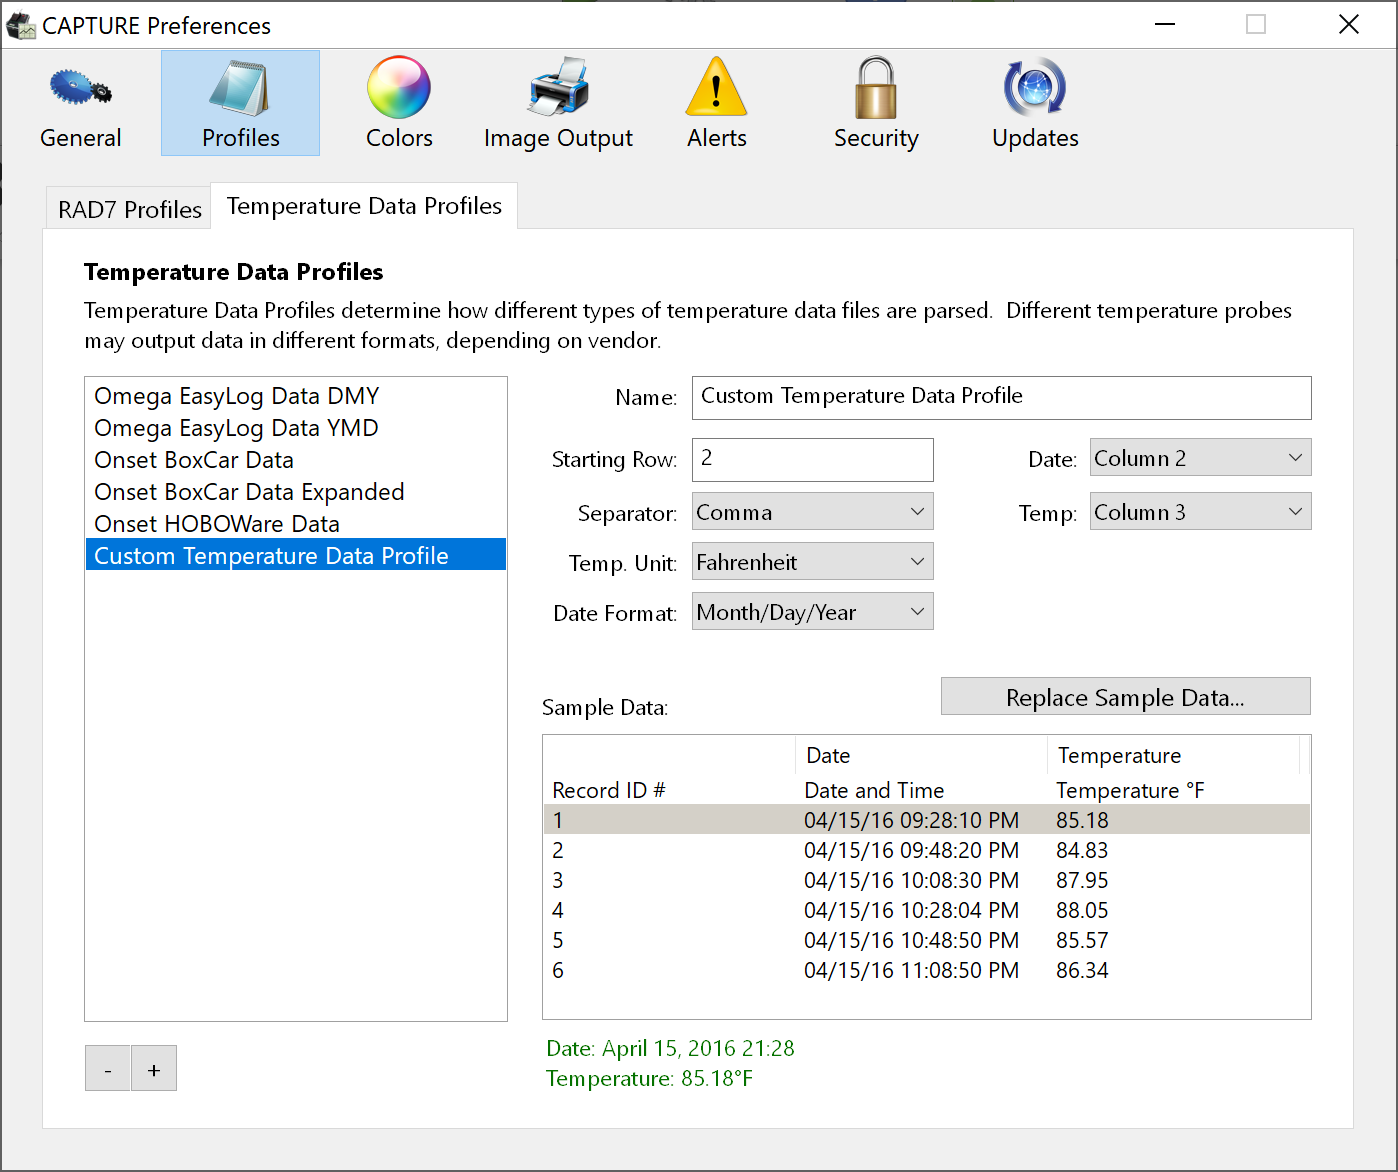
The Profiles Panel contains two tabs, labeled RAD7 Profiles and Temperature Data Profiles. RAD7 Profiles represent the characteristics of individual RAD7s, and they affect how the RAD7 data is interpreted when it is graphed. Temperature Data Profiles contain file format definitions that make it possible for CAPTURE to read the output of external third party temperature data loggers. Temperature logging is necessary when measuring radon in water using such accessories as the RAD AQUA or Big Bottle System, because the temperature of the water being tested must be known to derive its radon concentration. RAD7 Profiles and Temperature Data Profiles are explained in detail below.

RAD7 Profiles

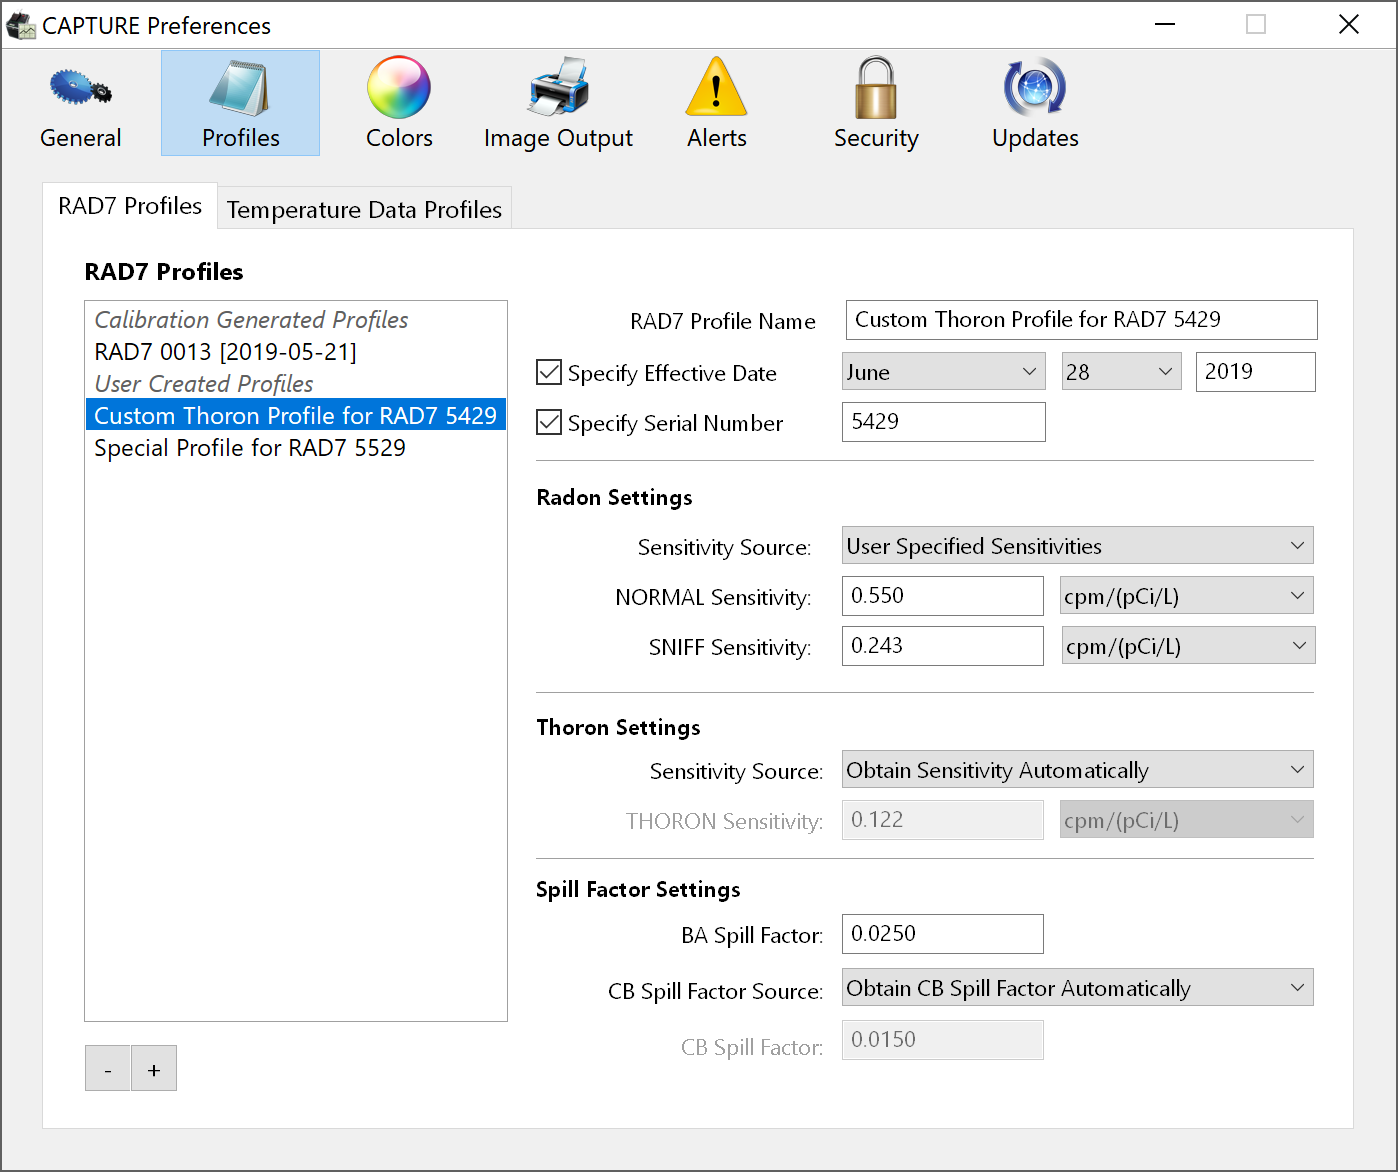
RAD7 data can be more accurately interpreted and displayed on a graph if certain information is available about the specific RAD7 which recorded the data. This RAD7 information is encapsulated in a RAD7 Profile and managed using CAPTURE. RAD7 Profiles are configured within the RAD7 Profiles panel in the Preferences Window. The list box on the left side of the RAD7 Profiles panel contains the names of the each RAD7 Profile. When a RAD7 Profile is selected, its details appear on the right side of the panel. When graphing data from a particular RAD7, the appropriate RAD7 Profile may be selected in the Graph Controls panel, and that profile's properties will influence the results shown on the graph.

There are two types of RAD7 Profiles: Calibration Generated Profiles and User Created Profiles. A Calibration Generated Profile will be created automatically when CAPTURE connects to a particular RAD7 for the first time, or when CAPTURE detects that a RAD7 has been recalibrated. These profiles contain information obtained directly from the RAD7, and they can not be modified. User Created Profiles are established manually, and they may be assigned custom property values to suit specific usage scenarios. For example a User Created RAD7 Profile's Thoron Sensitivity may be customized to compensate for the losses that occur during thoron retrieval when a laboratory drying unit is used, rather than the expected small drying tube.

The Plus [+] and Minus [-] buttons under the RAD7 Profiles list box are used to add and remove User Created RAD7 Profiles. Calibration Generated Profiles may not be added manually, but existing ones may be deleted.


Figure 2: A Calibration Generated RAD7 Profile.


When a Calibration Generated RAD8 Profile is selected, its NORMAL, SNIFF, and THORON Sensitivity values appear in the panel to the right, along with its CB and BA Spill Factors. Each of these values is obtained automatically from the RAD7 (provided the instrument contains the latest version of RADLINK), with one exception: the BA Spill Factor, which is always assumed to be 0.0250. If the RAD7 undergoes a specific calibration for thoron sensitivity, the instrument's BA Spill Factor will be known with greater certainty, and if it differs from 0.0250, a User Created RAD7 Profile should be added, and assigned this known BA Spill Factor value.

When a User Created RAD7 Profile is selected, an full set of configuration controls appears. These controls fall into several categories, as described below.


Figure 3: A User Created RAD7 Profile.


Profile Identification Settings

The first set of controls to the right of the RAD7 Profiles list box lets you specify the name of a User Created RAD7 Profile, and (optionally) an Effective Date and RAD7 Serial number. If the latter properties are specified, CAPTURE will automatically select the profile when a data file with matching properties is opened. However User Created Profiles are generally assigned manually, using the controls in upper left corner of the Graph Window.

Radon Settings

The Radon Settings controls are used to configure a User-Created RAD7 Profile's NORMAL and SNIFF Sensitivity settings. The Sensitivity Source pop-up menu is used to specify whether the NORMAL and SNIFF Sensitivities are obtained automatically, versus being manually specified by the user. If the first option is selected, the NORMAL and SNIFF Sensitivities are determined by analyzing data obtained from the RAD7 (provided the latest version of RADLINK is present on the instrument). If the second option is chosen, the sensitivity values must be entered by the user.

Thoron Settings

The Thoron Settings controls are used to configure a User Created RAD7 Profile's THORON Sensitivity settings. The Sensitivity Source pop-up menu is used to specify how the THORON Sensitivity is obtained. CAPTURE is usually able to obtain a RAD7's THORON Sensitivity automatically, in the same manner with which it obtains the instrument's NORMAL and SNIFF sensitivities. If the RAD7 has been specifically calibrated for Thoron, CAPTURE will likewise detect the calibrated THORON sensitivity and apply it to the corresponding Calibration Generated Profile, but it may nevertheless be advantageous to establish a User Created Profile for the thoron-calibrated RAD7, not only to affirm the calibrated THORON Sensitivity (which is stated on the signed Thoron Calibration Certification Report provided by DURRIDGE), but also to accommodate the calibrated BA Spill Factor, which is calculated only during the thoron calibration procedure. The BA Spill Factor is explained below.

Spill Factor Settings

A RAD7's BA Spill Factor represents the degree to which radon readings must be corrected in the presence of high thoron. This value should be manually entered in the BA Spill Factor field. It can be obtained from the Thoron Calibration Certification Report provided by DURRIDGE after a RAD7 has been specifically calibrated for thoron. If a specific thoron calibration has not been conducted, use the default value of 0.0250.

A RAD7's CB Spill Factor represents the degree to which thoron readings must be corrected in the presence of high radon. The CB Spill Factor Source pop-up menu is used to specify whether the CB Spill Factor is obtained automatically, versus being manually specified by the user. It may be obtained automatically from the RAD7 if the instrument contains the latest version of RADLINK. Otherwise, it should be entered manually. The CB Spill Factor value can be obtained from the signed RAD7 Calibration Certificate provided by DURRIDGE.

Temperature Data Profiles

When a RAD AQUA, Water Probe, or Big Bottle System is used to collect radon data from an underwater source, CAPTURE accounts for the water temperature in order to calculate the exact radon in water concentration. The necessary calculations are performed automatically, but usually it is necessary to provide CAPTURE with a Temperature Data File consisting of water temperature records obtained using a temperature logging device. The RAD7 itself is not equipped to record water temperatures.

A temperature logging device with a serial or USB interface should be used to record water temperature values at appropriate intervals. After the temperature data has been recorded to the logger, the data must be transferred to the computer. CAPTURE has built-in support for the Omega OM-EL-USB-TC temperature logger. Software for obtaining temperature data from other loggers is available from the device manufacturer.

CAPTURE can only interpret temperature data properly if it is given a complete definition of the format in which the data is stored. The Preferences Window's Temperature Data Profiles tab provides controls for specifying these formats.


Figure 4: A Temperature Data Profile.

The Temperature Data Profiles list on the left side of the window contains the names of each profile. CAPTURE comes bundled with a collection of built-in profiles, which allow it to read data files that have been saved using utilities available from the manufacturers of popular temperature loggers. These utilities include features for exporting temperature data to a text file which can be read by CAPTURE. Since CAPTURE does not include Temperature Data Profiles for every manufacturer, it may be necessary to define a custom Temperature Data Profile before the temperature data can be read by CAPTURE.

The Plus (+) and Minus (-) buttons under the Temperature Data Profiles list box are used to create and delete Temperature Data Profiles. Each profile consists of several configurable properties, including Name, Starting Row, Separator, Temperature Unit, and Date Format. Profiles also contain properties indicating which columns contain the Date and Temperature value of a reading. All of these can be modified using the controls on the right side of the window, which are described below. Note that the built-in Temperature Data Profiles can not be modified or deleted.


Name Field

The Name field contains the name of the selected Temperature Data Profile. Temperature Data Profiles should be given easily recognizable names, such as "Onset HOBOWare CSV Data". In this example, Onset is the name of the company that supplied the temperature logger, HOBOWare is the name of the software that is used to extract the data from the logger, and "CSV" indicates that the data is stored using the command Comma Separated Values delimitation format.


Starting Row Field

The Starting Row Field indicates which row contains the first line of actual data. For example, if the first line of a data file contains the column headings, then the Starting Row is likely row 2. In some cases the file's header may occupy two or more lines, increasing the Starting Row accordingly.


Separator Pop-Up Menu

The Separator Pop-Up Menu is used to specify whether data fields are separated by commas or tab characters. Commas have become a popular delimitation character in recent years, with the growth of the CSV ("Comma Separated Values") format.


Temp. Unit Pop-Up Menu

The Temp Unit Pop-Up Menu is used to specify whether temperature data is stored in the Fahrenheit or Celsius scale.


Date Format Pop-Up Menu

The Data Format Pop-Up Menu is used to specify whether date is expressed in Month/Day/Year format, Day/Month/Year format, or Year/Month/Day format.


Date Pop-Up Menu

The Date Pop-Up Menu is used to specify which data column contains dates and times. This information should be in a standard format; for example 09/06/10 06:09:37.0.


Temp. Pop-Up Menu

The Temp. Pop-Up Menu is used to specify which data column contains temperature data. Temperature values may be expressed in either Celsius or Fahrenheit units.

 
As you configure a Temperature Data Profile's properties, it may be useful to load a sample temperature data file for the purpose of validating the configuration. To do this click the Replace Sample Data button and select a temperature data file. If the Profile's properties have been specified correctly, the Sample Data table will be filled with organized, identifiable data, and Date and Temperature headings will appear at the top of the appropriate columns. The green text under the Sample Data table will display the date and temperature values extracted from the row selected in the Sample Data table.


Colors Panel

The Colors panel provides access to controls for customizing the colors used when rendering graph lines. The Colors panel also contains controls for adjusting the opacity of graph content, and restoring the default color settings.


Figure 5: The Colors Preferences Panel.


Graph Line Colors

Colors for each graph line can be changed by clicking the corresponding rectangle and selecting a replacement color from the standard system color picker.


Lightened Graph Line Opacity Slider

The Lightened Graph Line Opacity Slider is used to control the opacity of the rough data lines that appear in the background of the graph when smoothing is enabled.


Grid Line Opacity Slider

The Grid Line Opacity Slider is used to control the opacity of the horizontal and vertical grid lines that may be displayed in the background.


Restore Default Colors Button

The Restore Default Colors button removes any custom colors and reverts to the original color settings.


Image Output Panel

The Image Output panel provides access to controls for customizing the appearance of graph images that are printed and saved to disk.


Figure 6: The Image Output Preferences Panel.


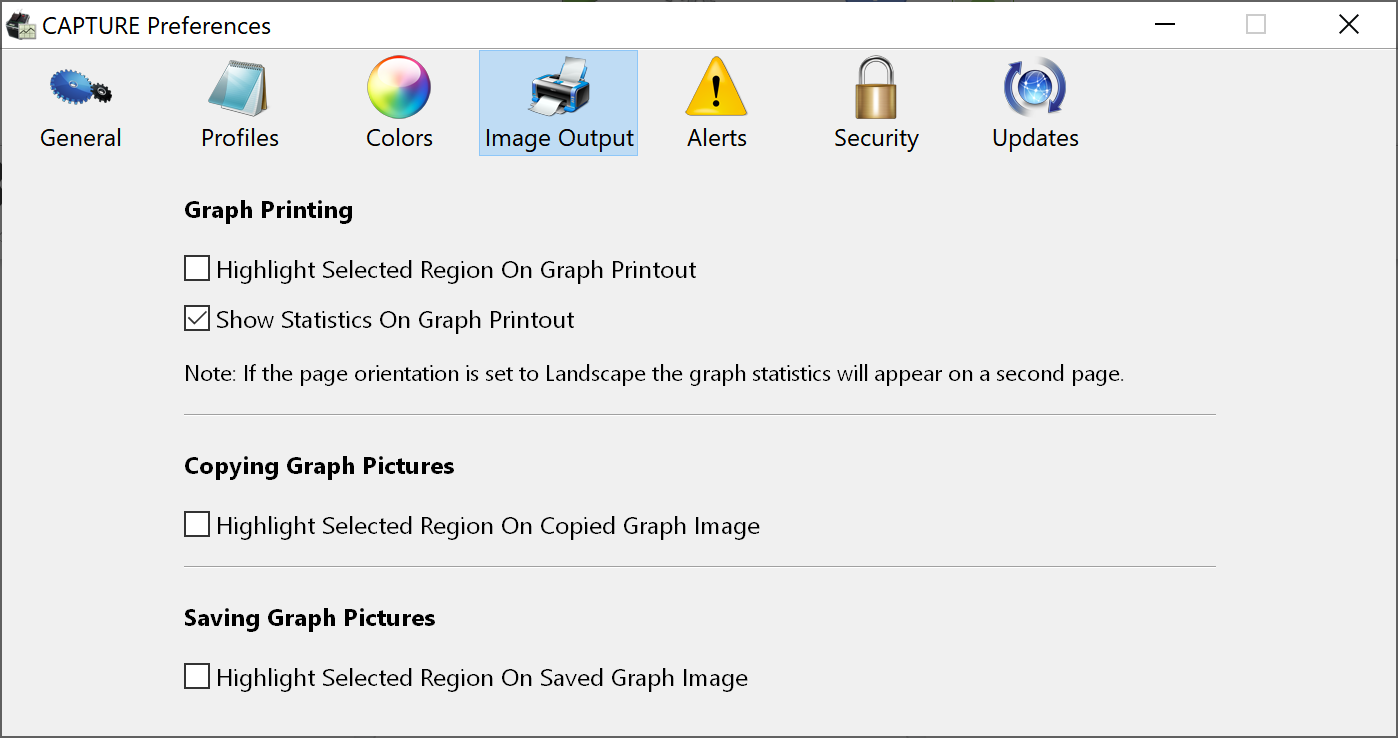
Highlight Selected Region On Printout Checkbox

Determines whether the selected region is highlighted on the printed graph output.


Show Statistics On Printout Checkbox

Determines whether statistics pertaining to the selected region appear on the printed output. Note that these statistics can only appear if the printout uses a portrait orientation. Printed graphs that use the landscape orientation take up the entire page, leaving no room for statistics.


Highlight Selected Region On Copied Image Checkbox

Determines whether the selected region is highlighted on the image when it is copied to the clipboard.


Highlight Selected Region On Graph Picture Checkbox

Determines whether the selected region is highlighted on the image when it is saved to disk.
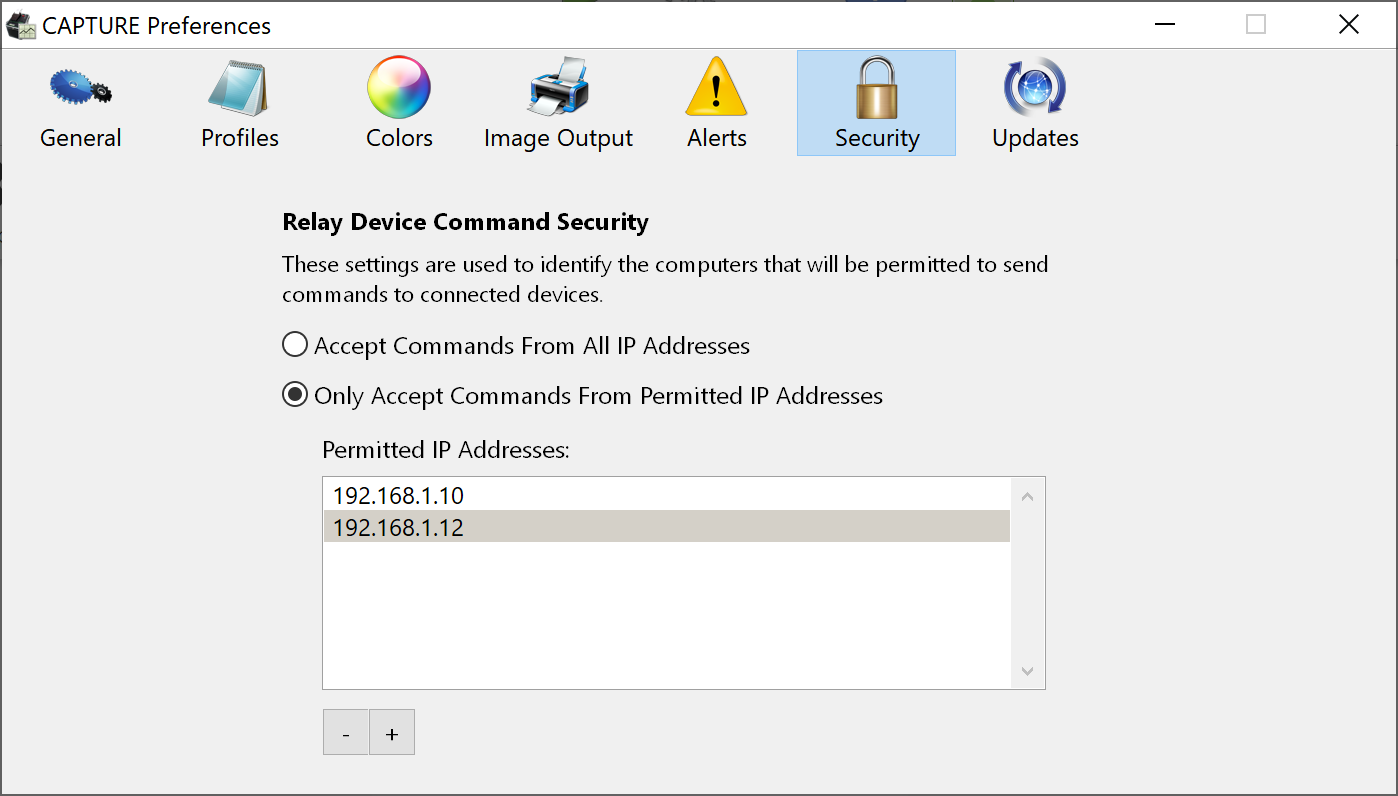

Alerts Panel

The Alerts panel contains controls used to specify which common alert messages are disabled. Each individual message can also be suppressed by clicking its "Do not show this message in the Future" checkbox before dismissing it. The purpose of each alert message is described under the checkbox used to disable it.


Figure 7: The Alerts Preferences Panel.


Security Panel

The Security panel provides access to controls for protecting RAD7s from commands issued by unauthorized Internet Protocol (IP) addresses.


Figure 8: The Security Preferences Panel.


Relay RAD7 Command Security

The Relay RAD7 Command Security controls are used to identify the computers that will be permitted to send commands to connected RAD7s.

If the Accept Commands From All IP Addresses radio button is selected, commands may be relayed to a connected RAD7 regardless of the IP address of the computer sending the commands.

If the Only Accept Commands From Permitted IP Addresses radio button is selected, then only computers using the IP addresses that have been entered into the Permitted IP Addresses list will be allowed to issue commands. Use the Plus (+) and Minus (-) buttons to add and remove addresses from the list.
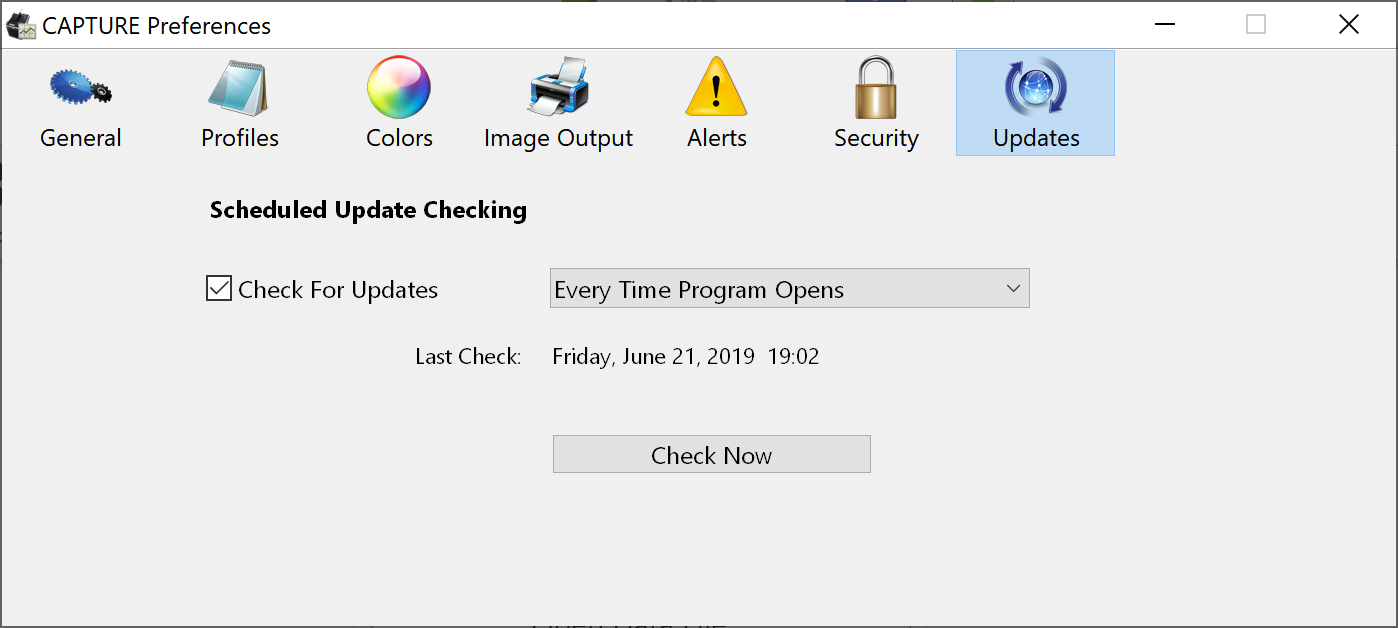

Updates Panel

The Updates panel provides access to controls for checking to see if updates are available for CAPTURE. It is also possible to configure CAPTURE to check for updates automatically.


Figure 9: The Updates Preferences Panel.


Check For Updates Checkbox

Determines whether CAPTURE will automatically check for updates at scheduled intervals. When an update becomes available, a button labeled Update Available will appear in the lower right corner of the Main Window. Clicking this button initiates the updating process.


Check frequency Pop-Up Menu

This pop-up menu determines how often CAPTURE performs automatic checks for updates. CAPTURE may be set to check for updates every time it opens, daily, weekly, or monthly.


Check Now Button

Checks for CAPTURE updates immediately, regardless of the above scheduled update settings.