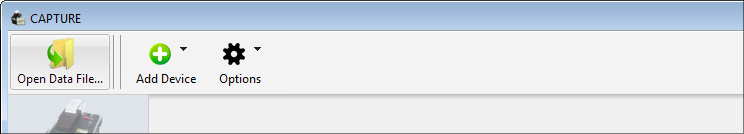
Figure 1: The Open Data File toolbar button.
|
Graph Configuration |
|
When data is downloaded from a RAD7 a graph window appears. Previously downloaded RAD7 Data may also be graphed. To do this either choose Open Data File... from the File menu, or click the Open Data File button on the Main Window toolbar, which is shown in Figure 1, below. |
|
Figure 1: The Open Data File toolbar button. |
RAD7 data files are selected using the standard system Open dialog box. RAD7 data files will typically be identified by a R7RAW or R7CDT file name extension and a corresponding icon. (Information on the various types of RAD7 Data Files is available in the File Formats section.) Once a RAD7 data file has been chosen, it will be opened in a new Graph Window. If you wish to open one of the included sample RAD7 data files, choose Open Sample RAD7 Data File from the File menu, and use the submenu to select one of the available built-in sample files. If a water-related accessory such as the RAD AQUA, RAD H2O, Big Bottle System, or Water Probe was used, it is necessary to specify the Radon Measurement Method using the Run Parameters Dialog, as shown in Figure 2, below. To open the Run Parameters Dialog, choose the Run Parameters command in the File Menu, or click the pencil icon on the label that appears above the start of a run of data points on the graph. This dialog is used to specify the variables needed to calculate the concentrations of radon in water. Note that once the parameters of one or more runs have been modified, the Save command will become enabled in the File Menu. When RAD7 data files are reopened, any parameters that have been saved will be restored. If run parameters have been modified and an unsaved file is closed, CAPTURE will display a Save prompt, providing the opportunity to save the modified file. |
|
|
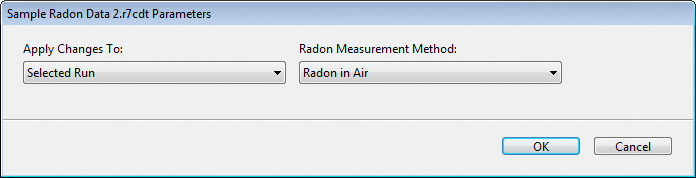 Figure 2: The Run Parameters Dialog, used for selecting a RAD7 data file to graph. |
|
If there are any problems with the RAD7 data but it is still partially readable, CAPTURE will graph any valid RAD7 Data records, and present a list of erroneous data lines. More information on handling problematic RAD7 Data is available in the Radon Data Errors section. |
If the RAD7 was monitoring radon in water with the aid of a DURRIDGE accessory such as the RAD AQUA, Water Probe, or Big Bottle System, it will be necessary to specify not only the RAD7 data file, but also water temperature data. This temperature data is needed in order to accurately calculate the concentration of the radon in water. Note that the RAD H2O is an exception, because unlike the Big Bottle System, the standard RAD H2O does not require temperature data. CAPTURE supports water temperature data from any of the following sources: RAD7 Air Temperature Fixed Temperature Value Omega OM-EL-USB-TC Temperature Logger To open RAD7 data recorded using the RAD AQUA, Water Probe, or Big Bottle System, select the appropriate accessory from the Radon Measurement Method pop-up menu. Next, specify the Water Temperature Source, as shown below: 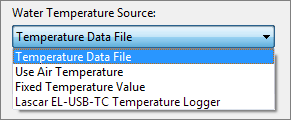 Figure 3: The Water Temperature Source pop-up menu in the Run Parameters dialog. If the Water Temperature Source is set to Temperature Data File, the screen shown in Figure 4 will appear. Click the Temperature Data File... button and select the file, which should be stored on disk. Next use the Temperature Data Profile pop-up menu to specify which profile should be used to read its data. CAPTURE contains built-in profiles for several common formats used in files exported from Onset Computing's BoxCar and HOBOware software, and EasyLog software. Profiles for other formats must be defined manually. The process of creating new Temperature Data Profiles is explained in the Preferences Window section. |
|
|
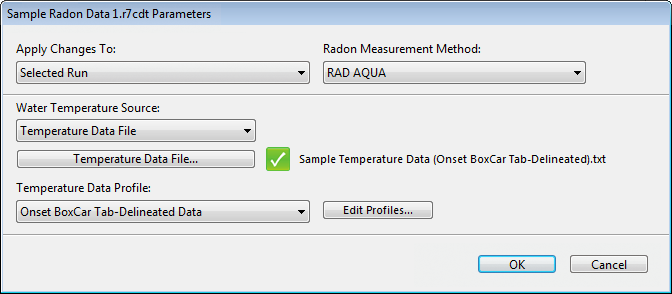 Figure 4: The Run Parameters dialog with the Radon Measurement Method set to a radon in water accessory that requires a water temperature source. The Water Temperature Source has been set to a temperature data file. |
If the Water Temperature Source pop-up menu is set to Air Temperature, the only further action required is to specify the Water Temperature Offset, as shown in Figure 5. The specified number of degrees (Fahrenheit or Celsius) will be added to the air temperature recorded by the RAD7 to determine the presumed water temperature. Generally a small negative number will be used. This option is most convenient but it may produce less accurate results. |
|
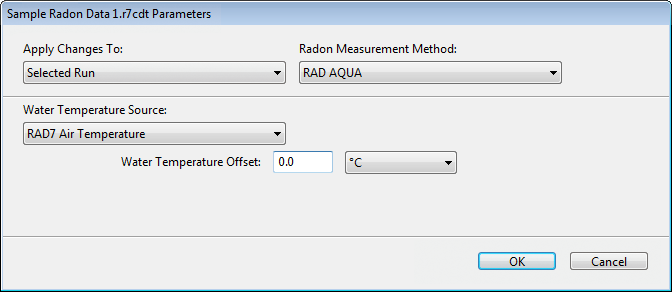 Figure 5: The Run Parameters dialog with the Radon Measurement Method set to a radon in water accessory that requires a water temperature source. The Water Temperature Source has been set to the RAD7 Air Temperature. |
If the Water Temperature Source pop-up menu is set to Fixed Temperature Value, simply specify the water temperature and unit (either Fahrenheit or Celsius), as shown in Figure 6. |
|
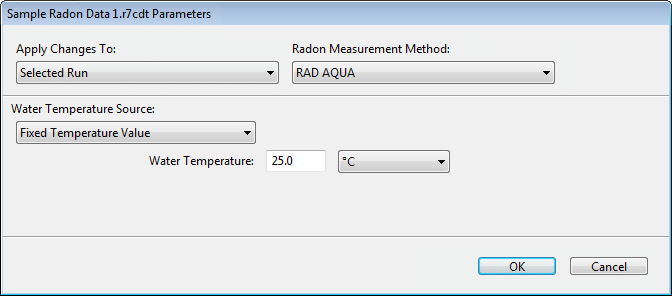 Figure 6: The Run Parameters dialog with the Radon Measurement Method set to a radon in water accessory that requires a water temperature source. The Water Temperature Source has been set to a Fixed Temperature Value. |
If Omega OM-USB-TC Temperature Logger is selected in the Radon Measurement Method pop-up menu, as shown in Figure 7, make sure an Omega OM-EL-USB-TC Temperature Data Logger is connected to the computer via USB. Use the Save Logger Data to Disk checkbox to specify whether the temperature data will be saved to disk after it has been obtained. This may be desired but it is not necessary, because the water temperature data will be stored in the RAD7 data file itself and saved accordingly. Downloading data from a temperature logger takes several seconds. To ensure optimal performance, the device should be set to log temperature readings no more frequently than once per minute. After the appropriate settings have been selected, click the OK button. The graph will display the display of Radon in Water data, and in some cases it will be possible to dispaly Thoron in Water and Water Temperature data as well. To avoid having to assign water temperature data every time the graph is opened, use the Save or Save As command to save the file after the desired changes have been made. Details for each radon in water accessory are discussed below. |
|
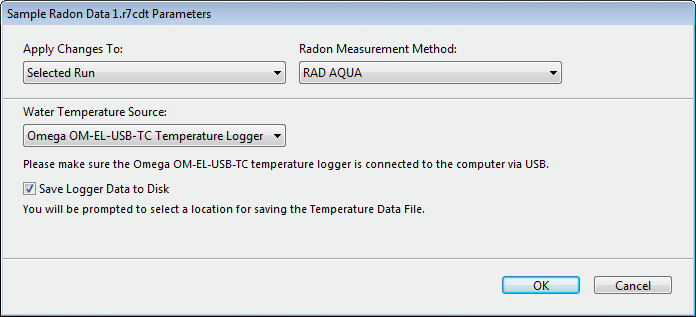 Figure 7: The Run Parameters dialog with the Radon Measurement Method set to a radon in water accessory that requires a water temperature source. The Water Temperature Source has been set to the Omega OM-EL-USB-TC Temperature Probe. |
CAPTURE handles data obtained using the RAD AQUA and Water Probe accessories similarly. In each case the Radon Measurement Method should be set to the appropriate accessory, and it is necessary to specify a Water Temperature Source, which may be set to any of the four options discussed above. It is recommended that temperature data be obtained from a Temperature Logger or an existing Temperature Data File, but the other options are acceptable if precise temperature information is unavailable. After clicking the OK button, a graph will appear in a new window. It will be possible to view a Radon In Water graph line, and in the case of the RAD AQUA Thoron in Water data will also be available. Water Temperature data will be viewable in all cases. Note that CAPTURE includes a stand-alone window for calculating a radon in water concentration based on user-provided radon in air and water temperature values. To access this window, click on the Tools menu in the menu bar, and select RAD H2O Radon In Water Calculator. This feature is used to calculate a single radon in water concentration, and it does not display a graph. See the Menu Commands section for details. |
|
If the RAD7 data being graphed was obtained with the use of the Big Bottle System accessory, then it will be necessary to specify the water temperature data as described above, as well as additional information on the specific Big Bottle System configuration used to aerate the water sample and obtain the radon data. To graph RAD7 data collected with the use of the Big Bottle System, first choose Big Bottle System from the Radon Measurement Method pop-up menu, as shown in Figure 8, below, and select a R7RAW or R7CDT RAD7 data file. Configure the temperature data settings as described above in the RAD AQUA section, using either a temperature data file or a fixed temperature value. Next specify the RAD7 Type. This may be a standard RAD7, a RAD7 with an oversized dome, or a Custom RAD7. If Custom is selected, it becomes possible to specify the RAD7 volume in the field below the RAD7 Type pop-up menu. After selecting the appropriate RAD7 Type, select the Drying Unit that was used. It may be one of the following:
If a Custom drying unit is selected, it is necessary to specify the volume of the drying unit in milliliters. Next, specify which kind of DRYSTIK, if any, was present in the experimental apparatus. Different DRYSTIK models have different internal air path volumes, which must be accounted for when calculating radon concentrations. It is also necessary to specify the Tubing+Aerator Cap Volume, Bubble Trap Volume (if any), Head Space, Bottle Volume, and Brim-Full Water Loss. The Ambient Radon parameter is optional; if it is not specified, the value defaults to 0.5 pCi/L. All of these settings affect the calculation of radon in water with regard to the volume of air inside the testing apparatus. When using the Big Bottle System in one of its preset configuration, these values may be left at their defaults. A preset can be chosen at any time by clicking the Restore Defaults button, near the base of the window, and selecting the desired bottle size from the menu that appears. Presets are available for a variety of bottle sizes and aerator cap types. Note that CAPTURE does not allow the user the specify a configuration in which the Drying Unit, DRYSTIK, and Bubble Trap absent and the aerator cap is of an insufficient volume, because experiments involving such a setup would present a high risk of water entering the RAD7. After the appropriate settings have been entered, click the OK button. The graph window will then permit the display of Radon in Water and Water Temperature graph lines, which are unavailable in conventional graphs. The graph should indicate a Radon In Water concentration somewhat lower than the Radon In Air concentration, as shown in Figure 9. Because of thoron's very brief half life, it is not possible to graph Thoron in Water concentrations obtained using the Big Bottle System. See the Big Bottle System manual for detailed information on interpreting this data, and the Graph Navigation section for more information on CAPTURE's graphing features. |
|
|
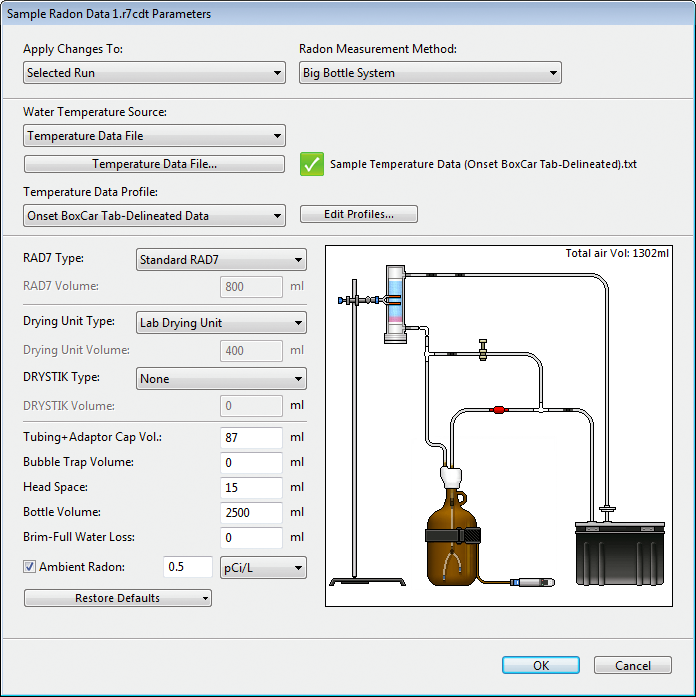 Figure 8: The Run Parameters dialog box with the Radon Measurement Method set to Big Bottle System, used for graphing radon in water data obtained through the Big Bottle System RAD7 accessory. |
|
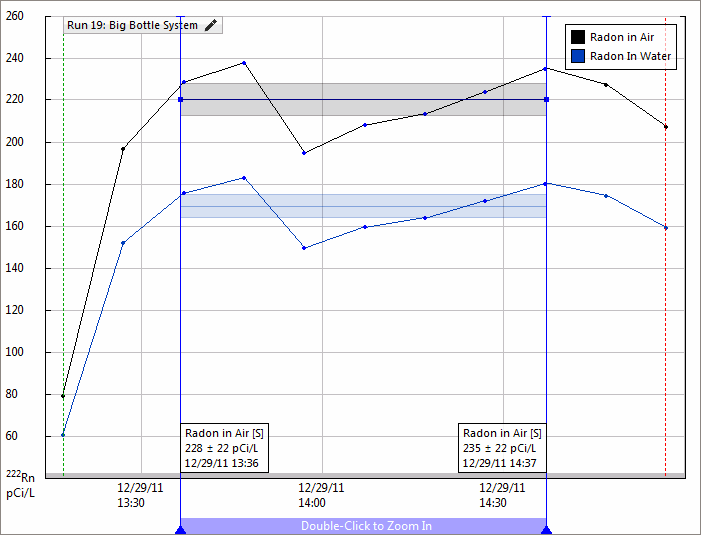 Figure 9: Typical graph of data obtained with the use of the Big Bottle System accessory. Radon in Water is represented by the blue graph line. The selected area represents the crucial 20-60 minute range.
|
When opening RAD7 data that was obtained using the RAD H2O accessory, the Radon Measurement Method should be set to RAD H2O in the Run Parameters dialog. Simply specify a R7RAW or R7CDT file and click OK. Temperature data is not used. When the graph appears, the Radon In Water graph line may be displayed, revealing valid WAT mode data points. (Note however that the concentrations of these Radon In Water data points will simply match the corresponding Radon In Air concentrations). Since water temperature data is not involved in computing radon concentrations, the Water Temperature graph line will be disabled. The Thoron In Water graph line will also be unavailable, because the brief half life of thoron means it will be undetectable by the time the water sample is aerated using the RAD H2O. See the RAD H2O manual for detailed information on interpreting this data, and the Graph Navigation section for more information on CAPTURE's graphing features. |
|
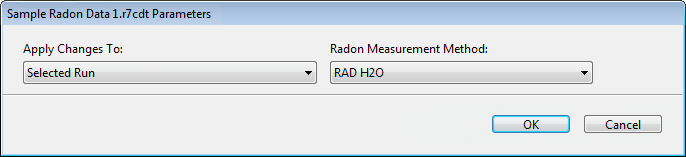 Figure 10: The Run Parameters dialog with the Radon Measurement Method set to RAD H2O, used for graphing radon in water data obtained through the RAD H2O RAD7 accessory.
 |
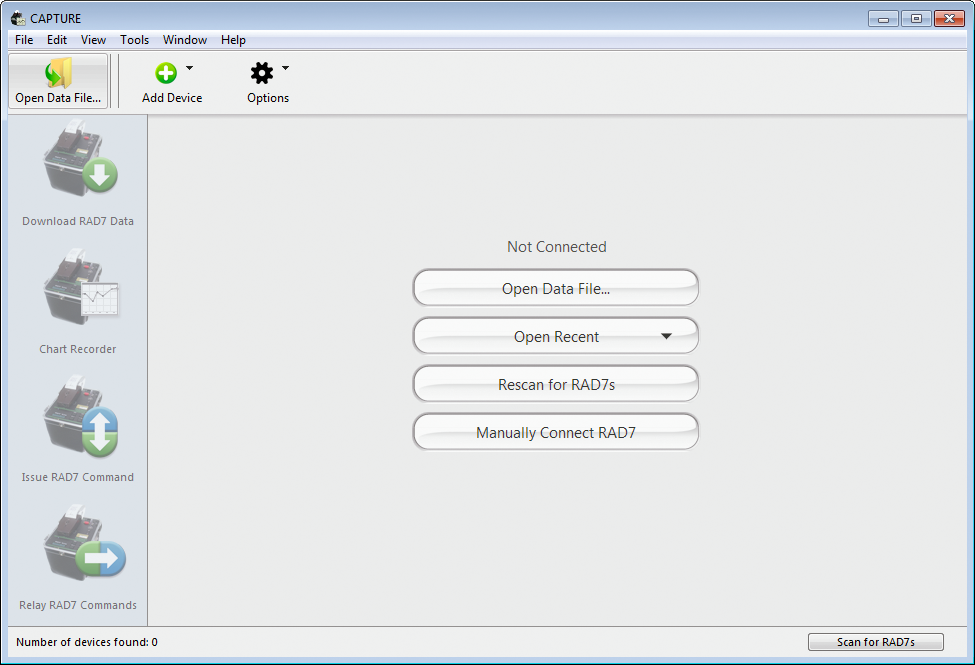
CAPTURE offers some quick and easy ways to open RAD7 data files. Before connecting to a RAD7, the Main Window will display an Open Data File button and an Open Recent pop-up menu, as shown in Figure 11, below. A list of recently opened files appears when this button is clicked. This list is also available through the Open Recent command in the File menu. Up to ten recently opened files will be remembered, with the newest items placed at the top of the list. R7RAW or R7CDT data files may also be opened by dragging them onto the CAPTURE icon, or by simply double-clicking them. |
|