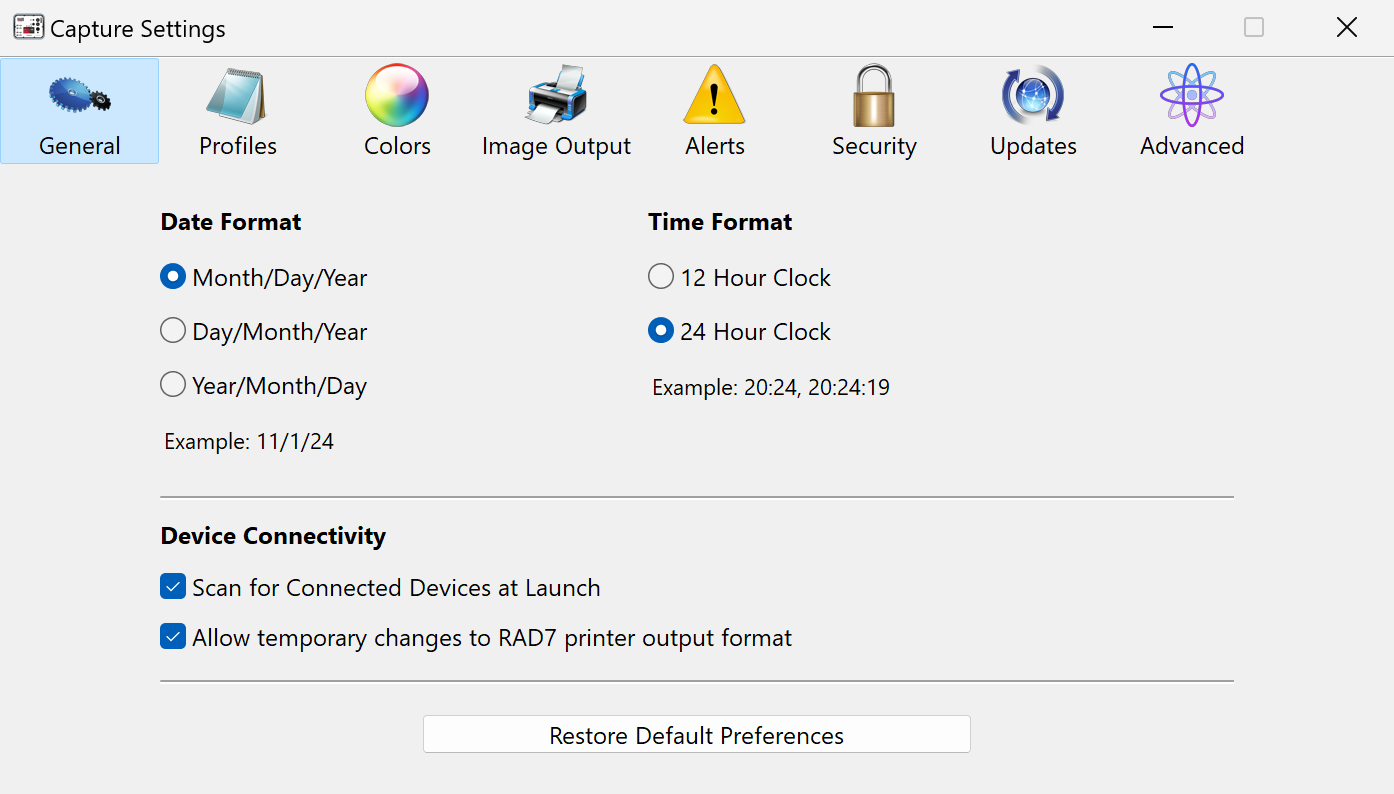
Figure 1: The General Settings Panel.
|
THE SETTINGS WINDOW |
|
Many important configuration options are made available in the Capture Settings Window. This window is accessed from the File Menu on Windows, and from the Application Menu on the macOS. Alternatively, you can bring up the Settings Window with the control-comma keyboard shortcut on Windows, and the command-comma shortcut on macOS. The Settings window consists of multiple panels, the contents of which are described below. |
| The General panel contains controls for specifying how Capture behaves when connecting to RAD7s, downloading RAD7 data, and formatting the downloaded information. These controls are described in detail below. | |
|
|
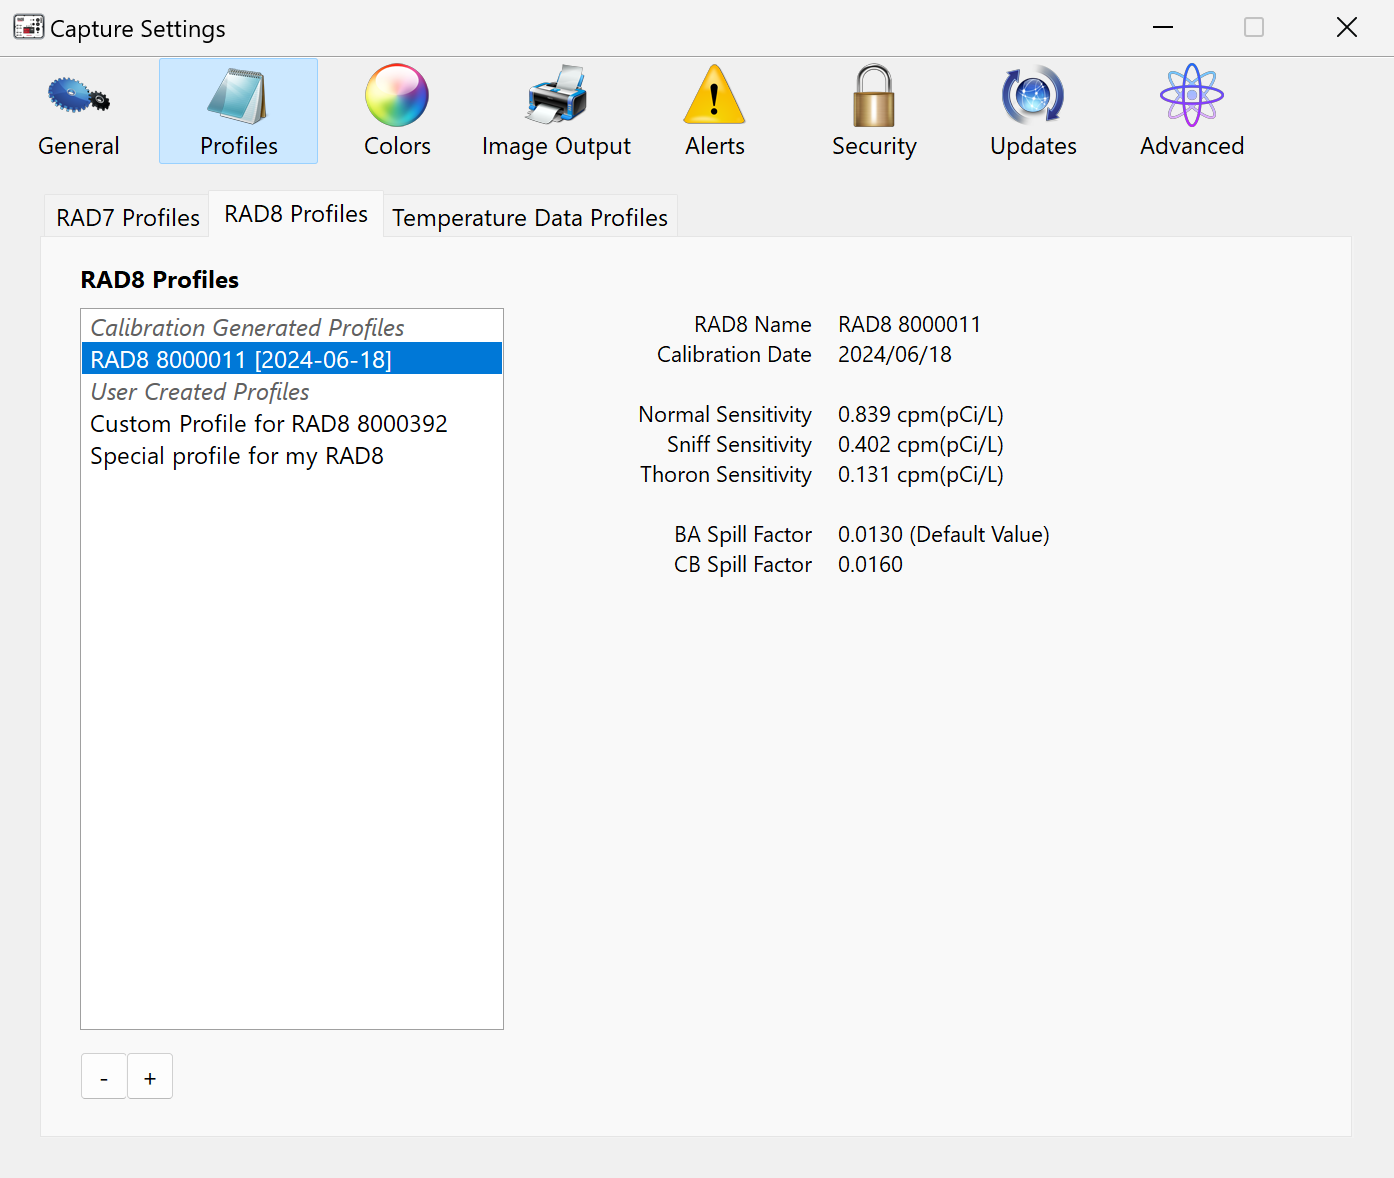
When a Calibration Generated RAD7 or RAD8 Profile is selected, its three Sensitivity values appear in the panel to the right, along with its CB and BA Spill Factors values. These values are obtained automatically from the instrument. In the case of the RAD7, the BA Spill Factor is always presumed to be 0.0250. If the RAD7 undergoes a specific calibration for thoron sensitivity, the instrument's BA Spill Factor will be known with greater certainty, and if it differs from 0.0250, a User Created RAD7 Profile should be added, and this known BA Spill Factor value should be assigend to the Profile. Note that the automatic retrieveal of a RAD7's Sensitivity and Spill Factor values requires that RADLINK is installed on the instrument. When a User Created RAD7 Profile is selected, an full set of configuration controls appears. These controls fall into several categories, as described below. |
|
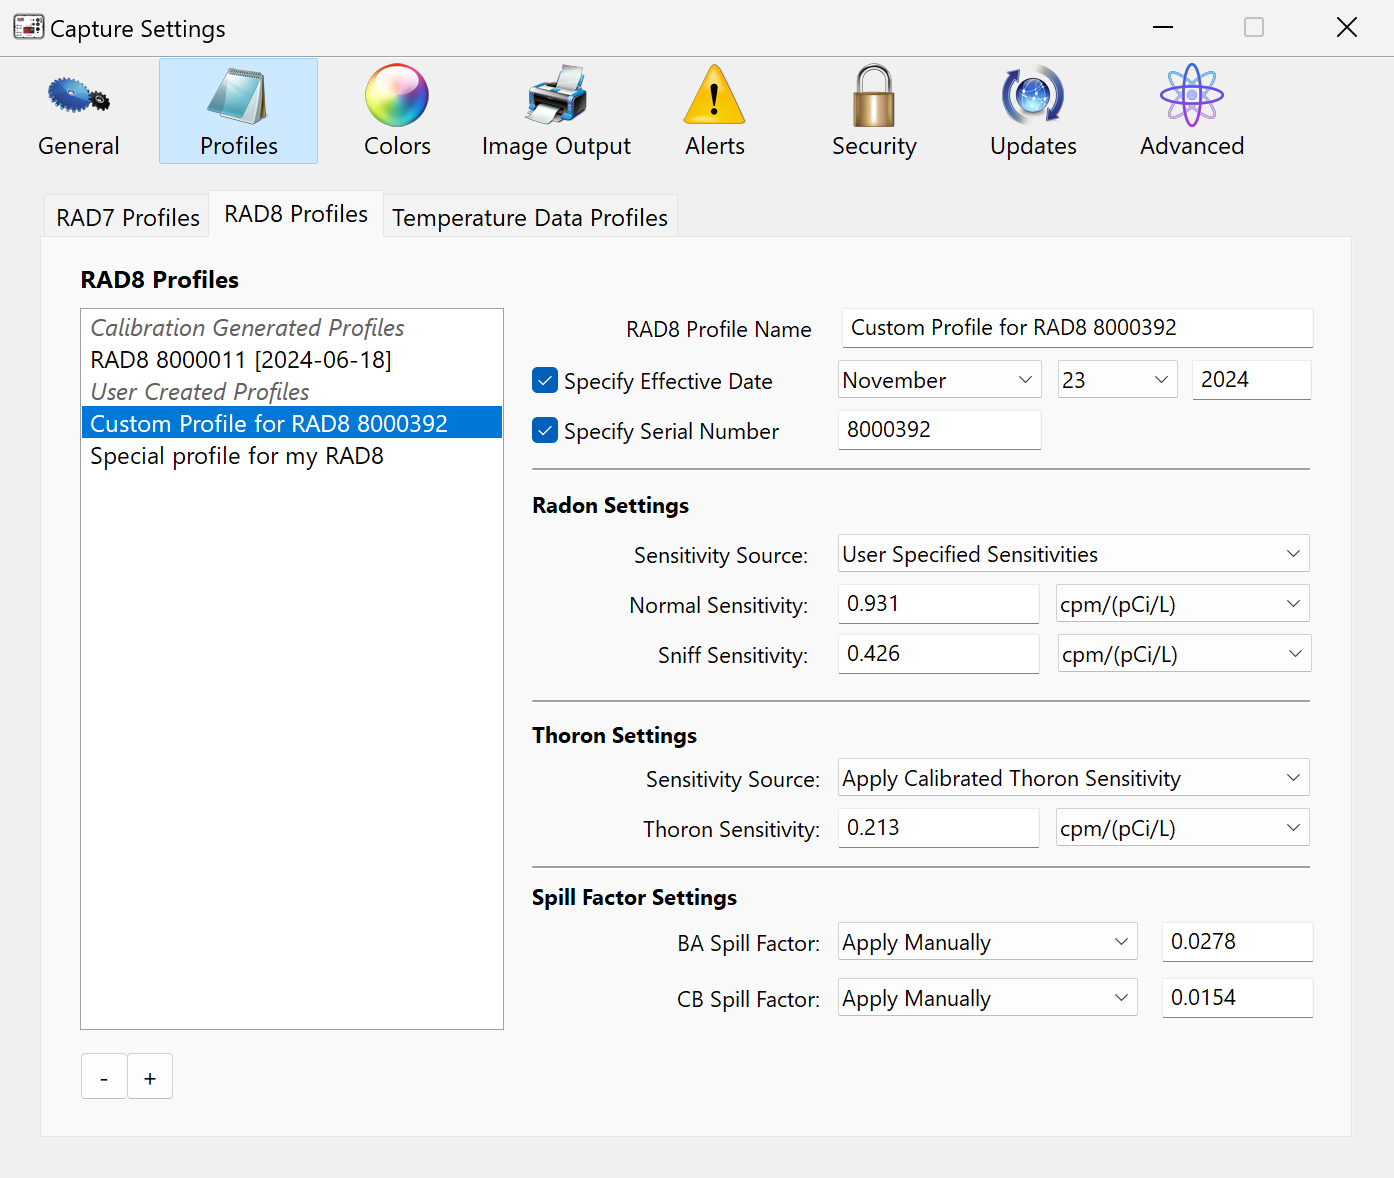
The first set of controls to the right of the RAD7 Profiles list box lets you specify the name of a User Created RAD7 Profile, and (optionally) an Effective Date and RAD7 Serial number. If the latter properties are specified, Capture will automatically select the profile when a data file with matching properties is opened. However User Created Profiles are generally assigned manually, using the controls in upper left corner of the Graph Window. Radon Settings The Radon Settings controls are used to configure a User-Created RAD7 Profile's NORMAL and SNIFF Sensitivity settings. The Sensitivity Source pop-up menu is used to specify whether the NORMAL and SNIFF Sensitivities are obtained automatically, versus being manually specified by the user. If the first option is selected, the NORMAL and SNIFF Sensitivities are determined by analyzing data obtained from the RAD7 (provided the latest version of RADLINK is present on the instrument). If the second option is chosen, the sensitivity values must be entered by the user. Thoron Settings The Thoron Settings controls are used to configure a User Created RAD7 Profile's THORON Sensitivity settings. The Sensitivity Source pop-up menu is used to specify how the THORON Sensitivity is obtained. Capture is usually able to obtain a RAD7's THORON Sensitivity automatically, in the same manner with which it obtains the instrument's NORMAL and SNIFF sensitivities. If the RAD7 has been specifically calibrated for Thoron, Capture will likewise detect the calibrated THORON sensitivity and apply it to the corresponding Calibration Generated Profile, but it may nevertheless be advantageous to establish a User Created Profile for the thoron-calibrated RAD7, not only to affirm the calibrated THORON Sensitivity (which is stated on the signed Thoron Calibration Certification Report provided by Durridge), but also to accommodate the calibrated BA Spill Factor, which is calculated only during the thoron calibration procedure. The BA Spill Factor is explained below. Spill Factor Settings A RAD7's BA Spill Factor represents the degree to which radon readings must be corrected in the presence of high thoron. This value should be manually entered in the BA Spill Factor field. It can be obtained from the Thoron Calibration Certification Report provided by Durridge after a RAD7 has been specifically calibrated for thoron. If a specific thoron calibration has not been conducted, use the default value of 0.0250. A RAD7's CB Spill Factor represents the degree to which thoron readings must be corrected in the presence of high radon. The CB Spill Factor Source pop-up menu is used to specify whether the CB Spill Factor is obtained automatically, versus being manually specified by the user. It may be obtained automatically from the RAD7 if the instrument contains the latest version of RADLINK. Otherwise, it should be entered manually. The CB Spill Factor value can be obtained from the signed RAD7 Calibration Certificate provided by Durridge. |
|
|
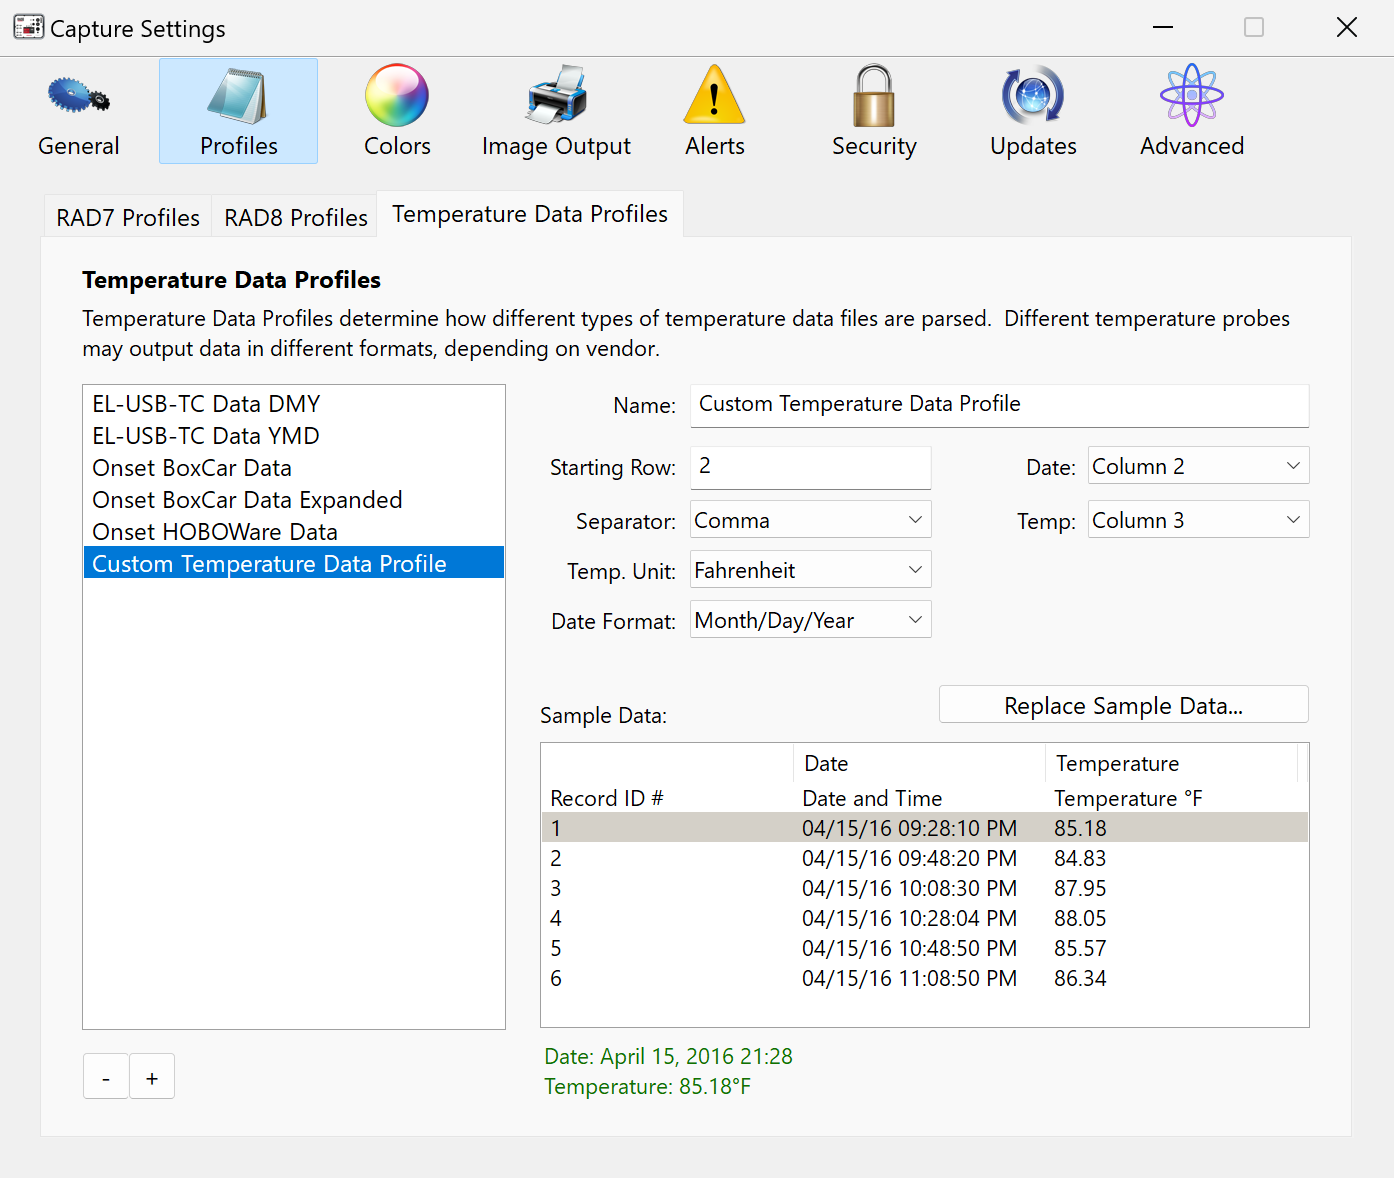
When a RAD AQUA, Water Probe, or Big Bottle System is used to collect radon data from an underwater source, Capture accounts for the water temperature in order to calculate the exact radon in water concentration. The necessary calculations are performed automatically, but usually it is necessary to provide Capture with a Temperature Data File consisting of water temperature records obtained using a temperature logging device. The RAD7 itself is not equipped to record water temperatures. A temperature logging device with a serial or USB interface should be used to record water temperature values at appropriate intervals. After the temperature data has been recorded to the logger, the data must be transferred to the computer. Capture has built-in support for the EL-USB-TC temperature logger manufactured by Lascar Electronics. Software for obtaining temperature data from other loggers is available from the device manufacturer. Capture can only interpret temperature data properly if it is given a complete definition of the format in which the data is stored. The Settings Window's Temperature Data Profiles tab provides controls for specifying these formats. |
|
|
|
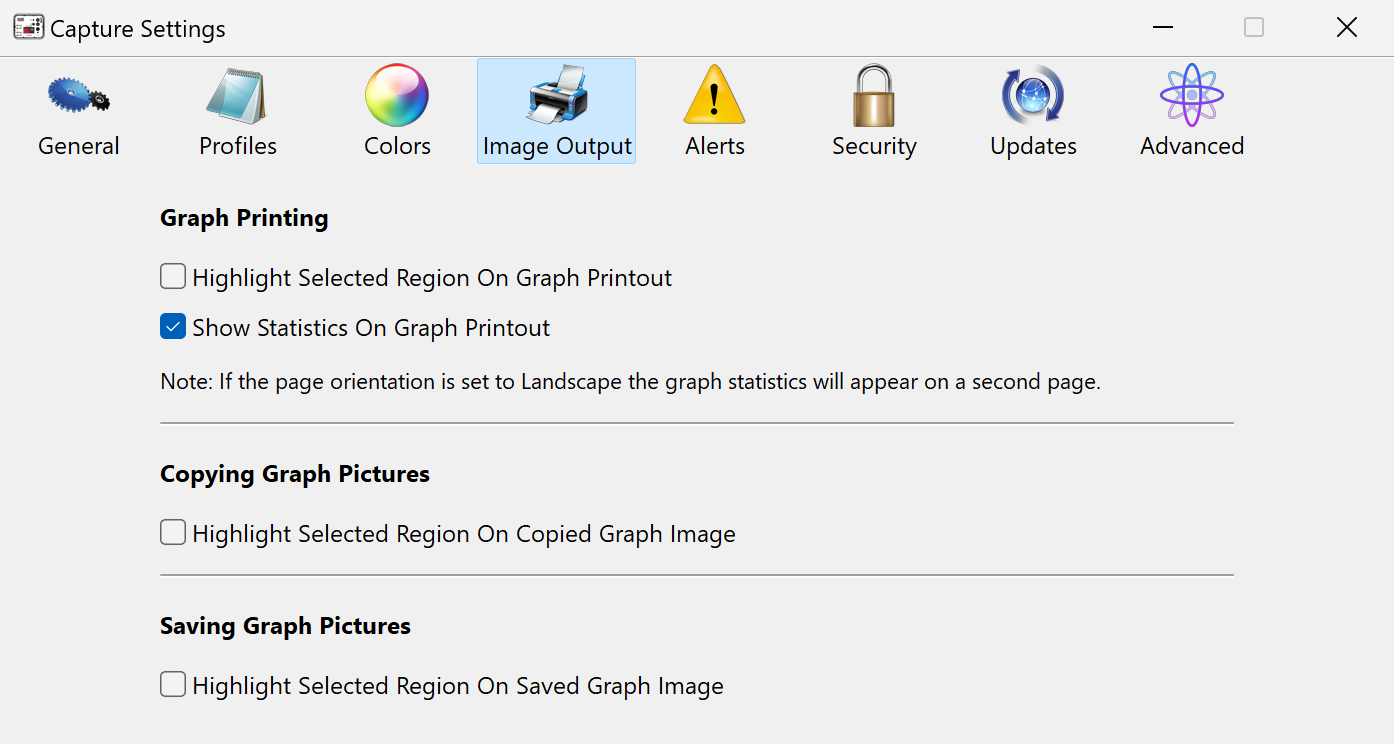
Highlight Selected Region On Printout Checkbox Determines whether the selected region is highlighted on the printed graph output. |
|
Show Statistics On Printout Checkbox Determines whether statistics pertaining to the selected region appear on the printed output. Note that these statistics can only appear if the printout uses a portrait orientation. Printed graphs that use the landscape orientation take up the entire page, leaving no room for statistics. |
|
Highlight Selected Region On Copied Image Checkbox Determines whether the selected region is highlighted on the image when it is copied to the clipboard. |
|
Highlight Selected Region On Graph Picture Checkbox Determines whether the selected region is highlighted on the image when it is saved to disk. |
|
|
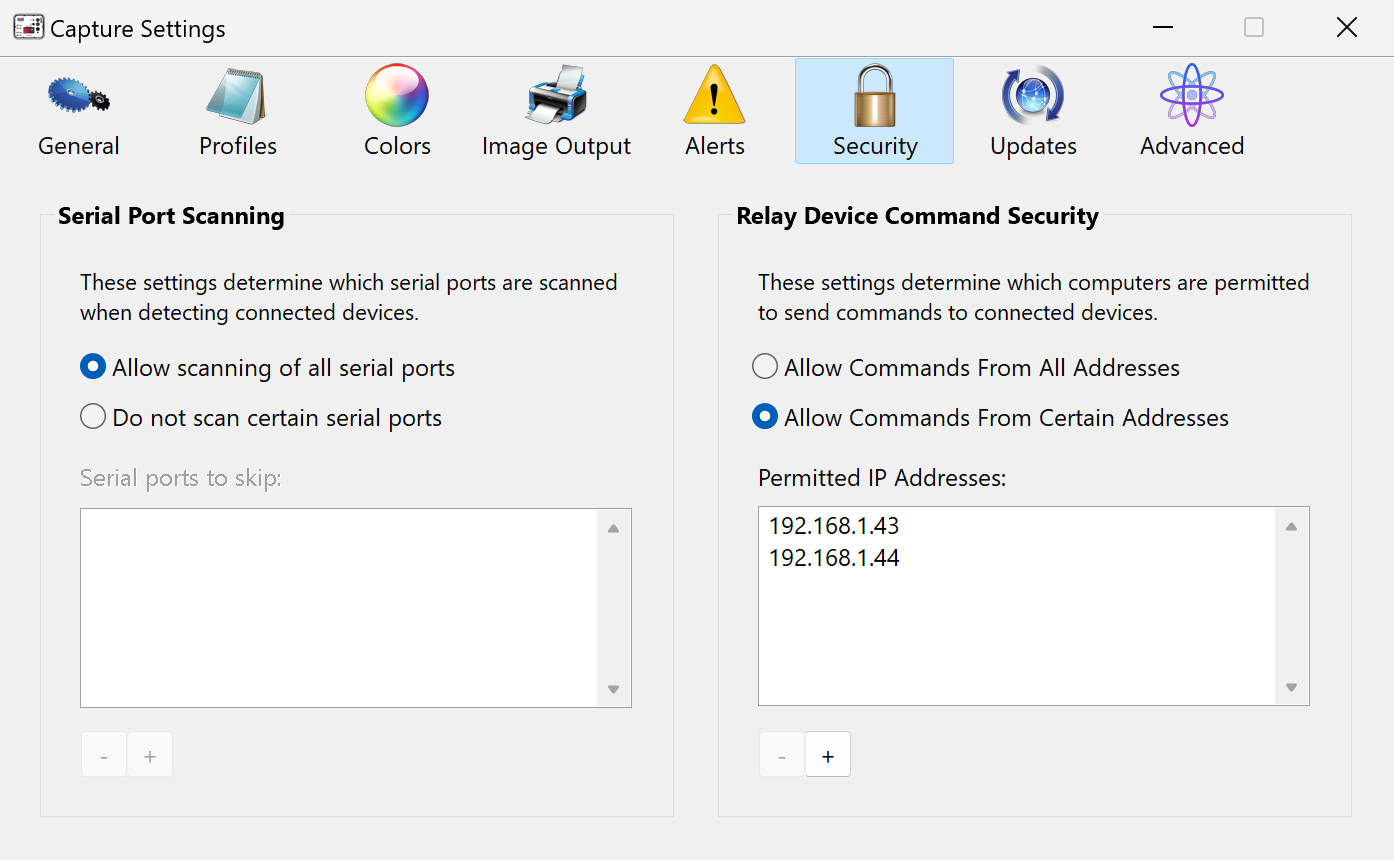
Serial Port Scanning The Serial Port Scanning controls are used to omit specified serial ports from the scanning process which is used to detect connected devices. This is useful if a particular serial port should be reserved for another application, or if the process of opening a particular port causes delays while launching Capture. If the Allow scanning of all serial ports radio button is selected, each serial port on the computer will be scanned when searching for connected devices. If the Do not scan certain serial ports radio button is selected, then the serial ports that have been entered into the Serial ports to skip list will be be omitted from the scanning process. Use the Plus (+) and Minus (-) buttons to add and remove serial ports to and from the list. |
|
Relay Device Command Security The Relay Device Command Security controls are used to identify the computers that will be permitted to send commands to connected RAD7s. If the Allow Commands From All Addresses radio button is selected, commands may be relayed to a connected RAD7 regardless of the IP address of the computer sending the commands. If the Allow Commands From Certain Addresses radio button is selected, then only computers using the IP addresses that have been entered into the Permitted IP Addresses list will be allowed to issue commands. Use the Plus (+) and Minus (-) buttons to add and remove addresses to and from the list. |
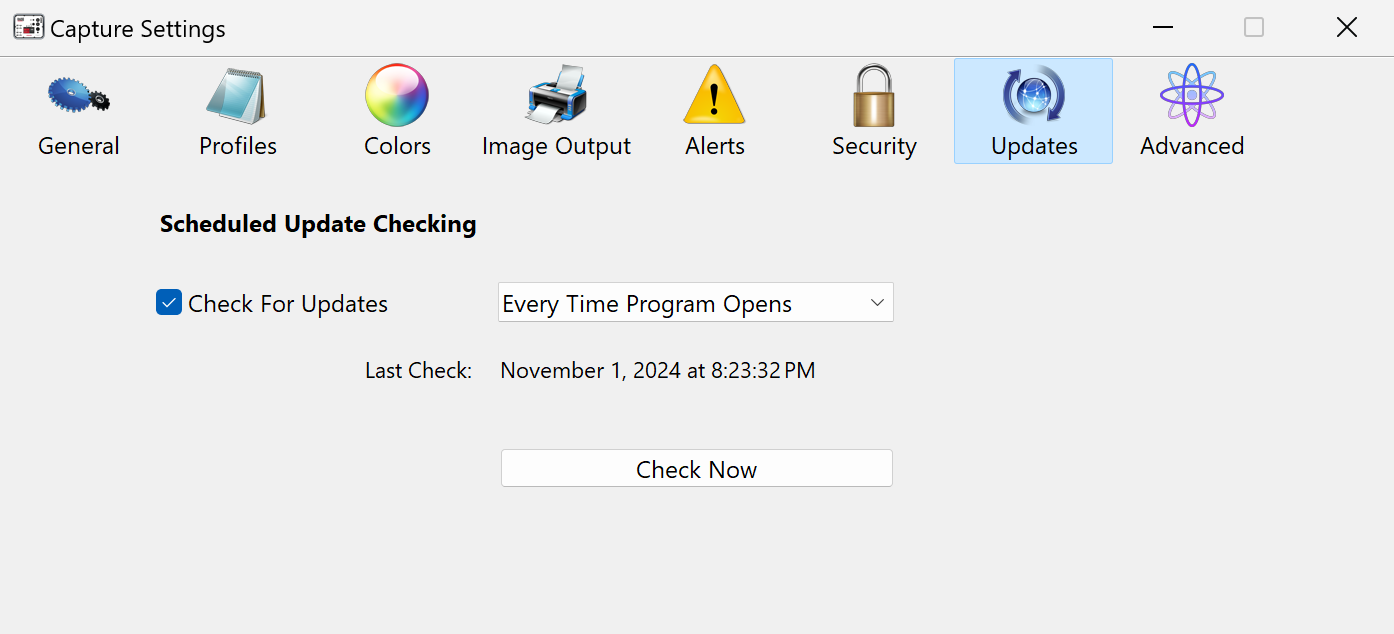
| Updates Panel | The Updates panel provides access to controls for checking to see if updates are available for Capture. It is also possible to configure Capture to check for updates automatically. |
|
Check For Updates Checkbox Determines whether Capture will automatically check for updates at scheduled intervals. When an update becomes available, a button labeled Update Available will appear in the lower right corner of the Main Window. Clicking this button initiates the updating process. |
|
Check frequency Pop-Up Menu This pop-up menu determines how often Capture performs automatic checks for updates. Capture may be set to check for updates every time it opens, daily, weekly, or monthly. |
|
Check Now Button Checks for Capture updates immediately, regardless of the above scheduled update settings. |
|
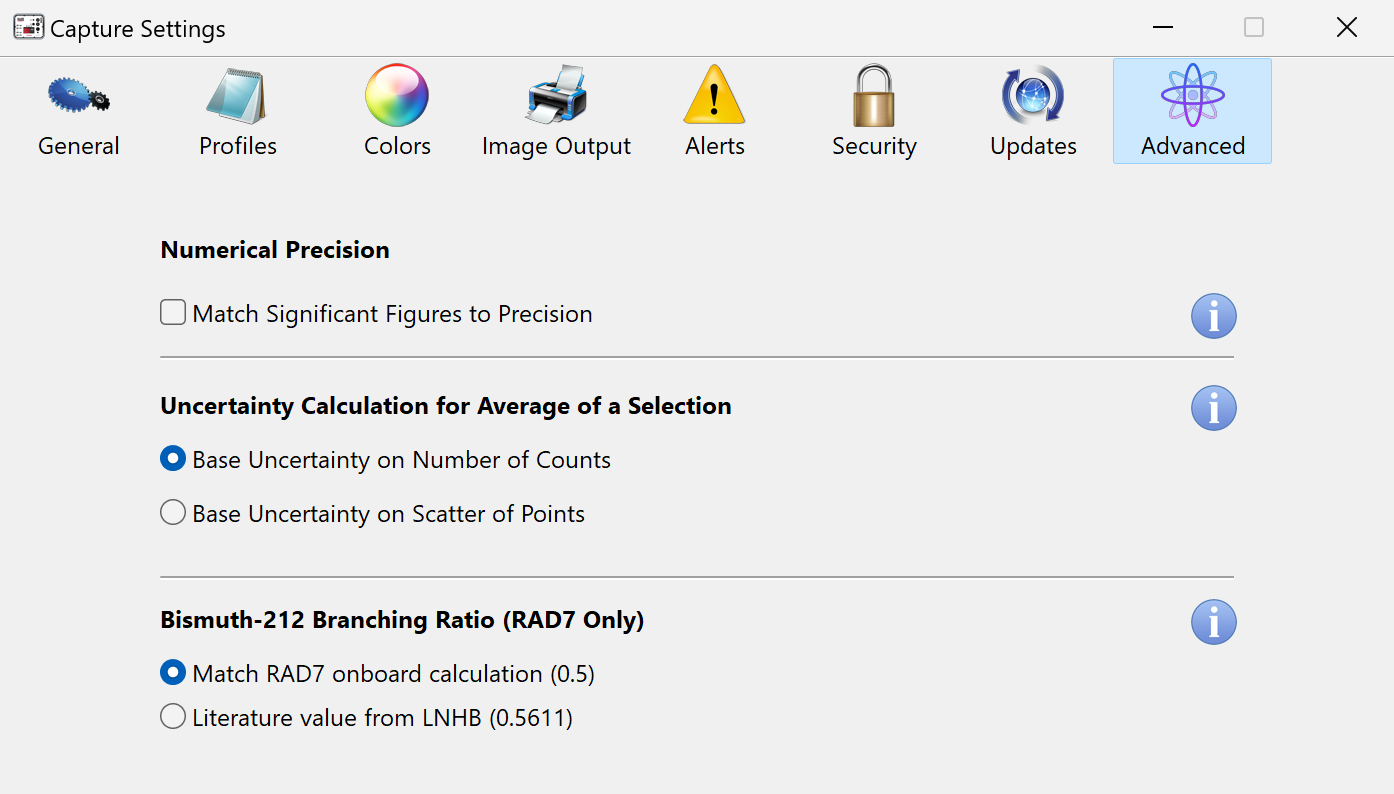
Match Significant Figures to Precisions Checkbox The Match Significant Figures to Precision checkbox is used to specify whether radon and thoron concentrations are expressed using fewer significant digits when the associated uncertainties are high. If this box is checked, an uncertainty greater than 150% of the base value will cause the concentration to be expressed using only one significant digit; an uncertainty greater than 15% of the base value will cause the concentration to be expressed using two significant digits; an uncertainty greater than 1.5% of the base value will cause the concentration to be expressed using three significant digits; and so on. Normally uncertainties are expressed using two significant digits, and base concentrations are always expressed using the same number of digits to the right of the decimal point as in the uncertainty value. |
|
Uncertainty Calculation for Average of a Selection Options There are two Uncertainty Calculation options: Base Uncertainty on Number of Counts, and Base Uncertainty on Scatter of Points. Basing the uncertainty on the Number of Counts involves Poisson statistics, and is applicable even when there is a significant variation in radon concentration during the period of the measurement. Basing the uncertainty on the Scatter of Points is applicable when there are more than ten readings and it is known that the radon concentration was steady during the period selected. Please note that the uncertainty, as displayed, refers only to the statistical uncertainty of the result. This is a measure of the precision of the reading. The result ignores any systematic bias due to uncertainty in the calibration, and traceability to national standards, which may be as much as ±5%. |
|
Bismuth-212 Branching Ratio Options When Thoron decays, it eventually produces bismuth-212, which has a chance to decay i) into polonium-212 (via beta emission), then lead-210 (via alpha emission), or ii) into thalium-208 (via alpha emission). In case i), the alpha decay of polonium-212 produces a count that appears in the D window. In case ii), the direct alpha decay of bismuth-212 produces a count that appears in the A window. The RAD8 and RAD7 use the A window counts to calculate the displayed radon activity concentration. Therefore, when measuring radon, it is necessary to discount the portion of the A Window counts that came from the direct decay of bismuth-212 in the thoron decay chain. Since the ratio of thoron-genic counts in the D window to those in the A window is fixed by nature, knowing the D window counts gives the instrument all the information it needs to correct the A window count for interference from thoron. The RAD7 accomplishes this by subtracting half of the D Window Counts from the A Window. However, the accepted value from the scientific literature (calculated by the Laboratoire National Henri Becquerel – LNHB - as the weighted average of four independent measurements made throughout the 1960s) is 0.5611, so Capture offers this as option as well, for increased accuracy. This bismuth-212 branching ratio is only consequential when measuring a low radon concentration in the presence of a high thoron concentration. Furthermore, this option only applies to RAD7 data. RAD8 data analysis always uses the LNHB value of 0.5611. |