THE CHART RECORDER |
|
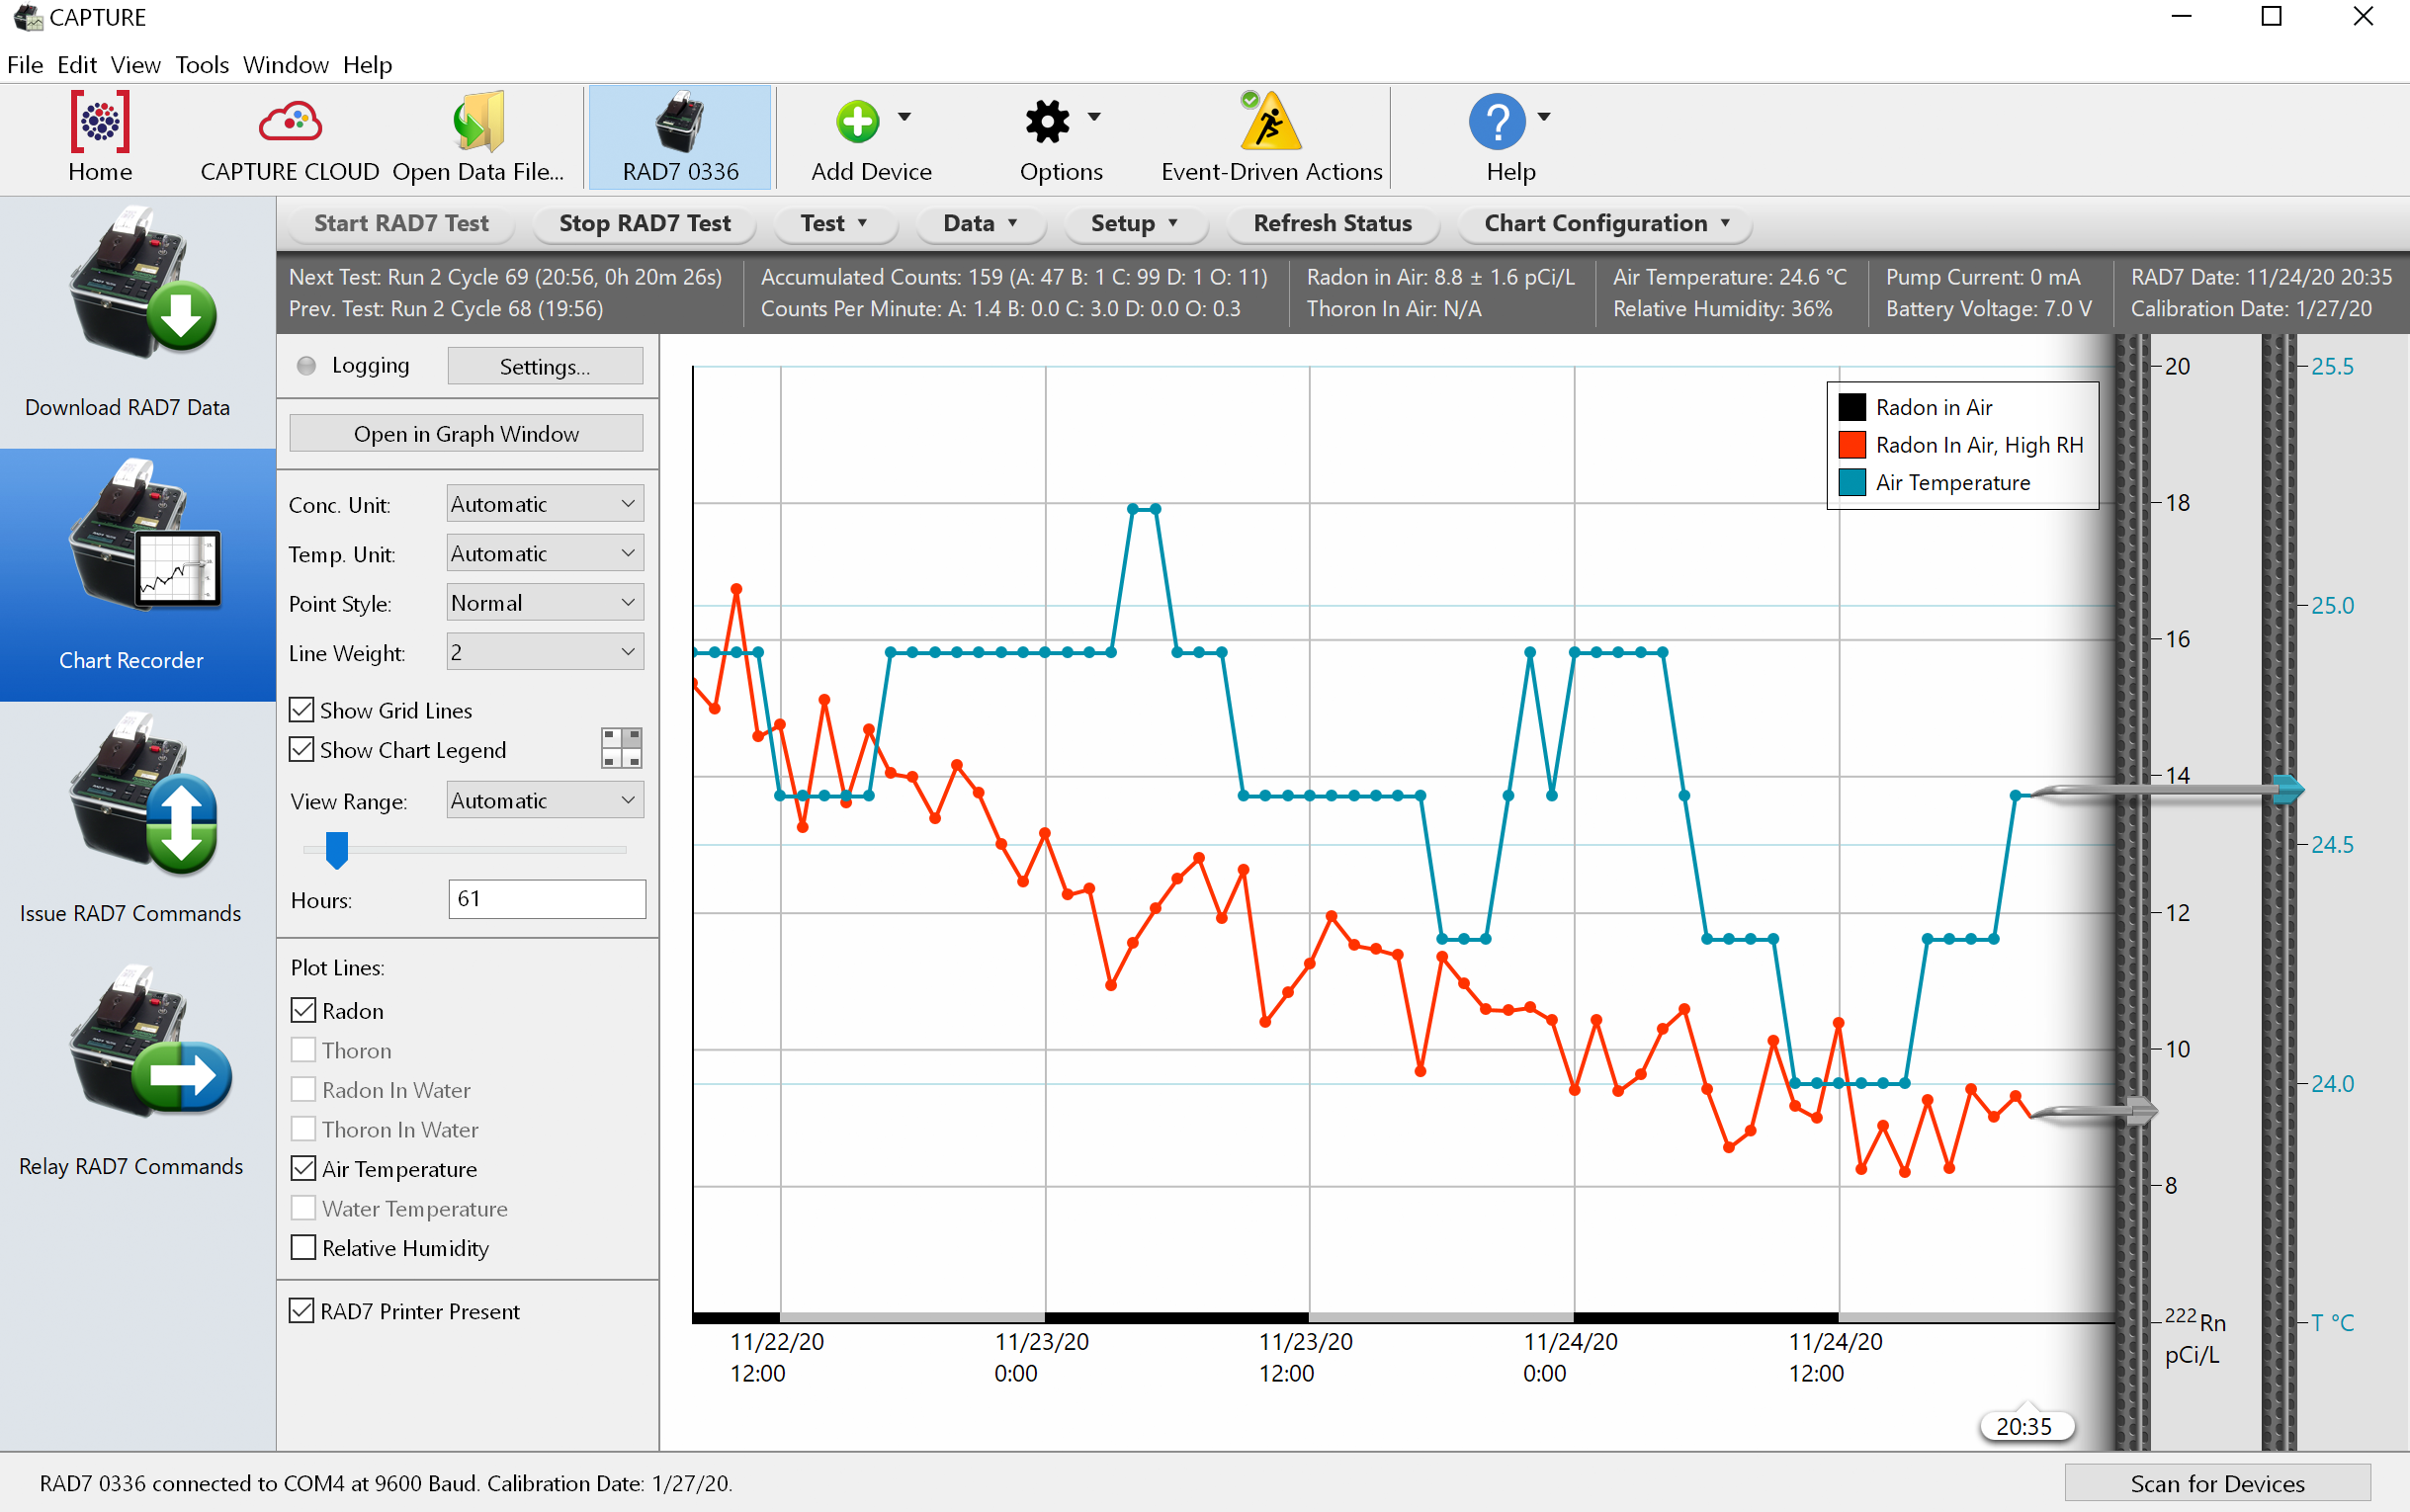
The Capture Chart Recorder displays a real-time graph of RAD8 or RAD7 data as it is recorded. As a radon test progresses, a set of virtual pens plot radon concentration, temperature, and humidity data. The chart slowly scrolls to the left in real time, so that the right edge of the chart represents the current time. The Chart Recorder contains a button bar for starting and stopping tests and configuring instrument settings. Below the Button Bar is a Status Display panel which indicates the current state of the selected RAD8 or RAD7. A nearby panel of Chart Recorder Controls is used to adjust the appearance and range of the Chart Recorder. These features and others are described in detail below. |
| |
The Start RAD7 Test button begins a RAD7 test and initiates real time data tracking. This button has the same effect as selecting Test Start on the actual RAD7. Likewise, the Stop RAD7 Test button emulates the RAD7's Test Stop function. The Test, Data, and Setup menus provide access to the set of commands available on corresponding menus on the RAD7 itself. Selecting one of these commands will have the same result as entering the equivalent command on the physical RAD7. These commands are described in Chapter 2 of the RAD7 User's Manual. Note that menu commands ending with ellipses (...), such as "Units..." and "Clock..." will present dialog boxes for specifying command parameters, as shown in the Figures 3 and 4, below. The Refresh Status Display button will update the statistics shown in the Chart Status Display, and will cause the Chart Recorder image to be refreshed. Normally this occurs automatically at regular intervals, but the Refresh Status Display button is useful when an immediate status update is desired. The Chart Configuration menu contains two commands: Logging Settings and Chart Parameters. The Logging Settings command is used to configure the program to log Chart Recorder data to disk as it arrives. This is explained in the Logging Chart Data section, below. The Chart Parameters command brings up the Chart Parameters Window, which is used to specify the Radon Measurement Method, which may be either Radon in Air, RAD AQUA, or Water Probe. If the RAD AQUA or Water Probe is selected, the Chart Recorder will be able to display radon-in-water data. Computing radon-in-water concentrations requires information about the water's temperature and salinity. The temperature can be set to either the air temperature as recorded by the RAD8 or RAD7 (plus or minus a fixed offset), or to a fixed temperature value, expressed in either Fahrenheit or Celsius. The salinity is expressed in parts per thousand (‰) The Chart Parameters Window is shown in Figure 5, below. |
|
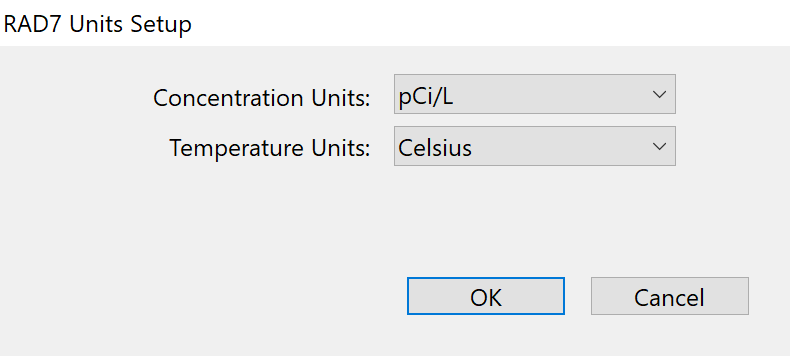 Figure 3: The Chart Recorder Units Setup dialog. |
|
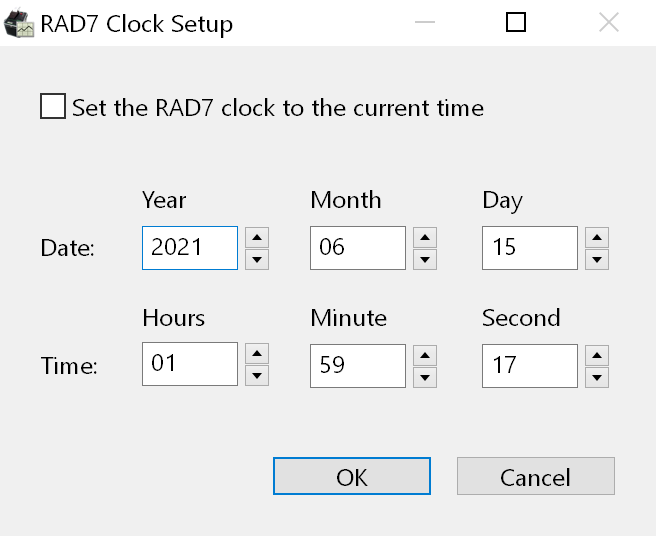 Figure 4: The Chart Recorder Clock Setup dialog. |
|
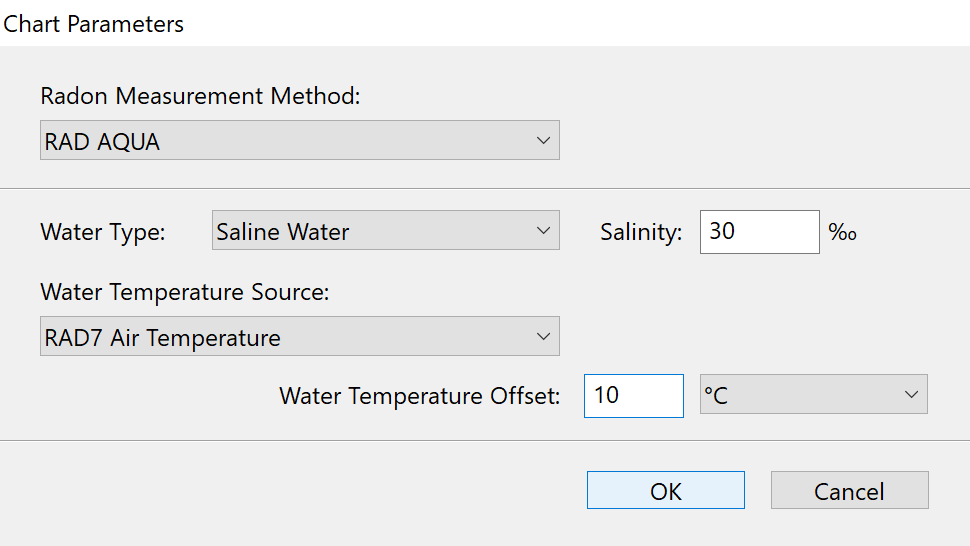 Figure 5: The Chart Parameters Window. |
|
Figure 6: The RAD7 Chart Recorder Status Display. |
| Monitoring Device Groups | The Chart Recorder is particularly useful for monitoring groups of RAD8s or RAD7s. Device Groups are user-specified sets of instruments whose data is averaged and displayed as a single chart. For best results the timing of the devices in the group should be synchronized. To configure a RAD8 Group or RAD7 Group, first make sure at least two RAD8s or RAD7s are connected and their icons are visible in the Main Window Toolbar. In the toolbar, select the Options Menu (which is labeled with a gear icon) and select Add RAD7 Group... or Add RAD8 Group... The Group Configuration Window will appear, as shown below. This window is used to specify the Group's name and its member devices. After the Group has been configured, it will appear as an icon in the Toolbar, next to the other devices. A numeral on the icon will indicate how many instruments belong to the group. Selecting a Device Group causes displays a chart representing an average of the data belonging to the member devices. 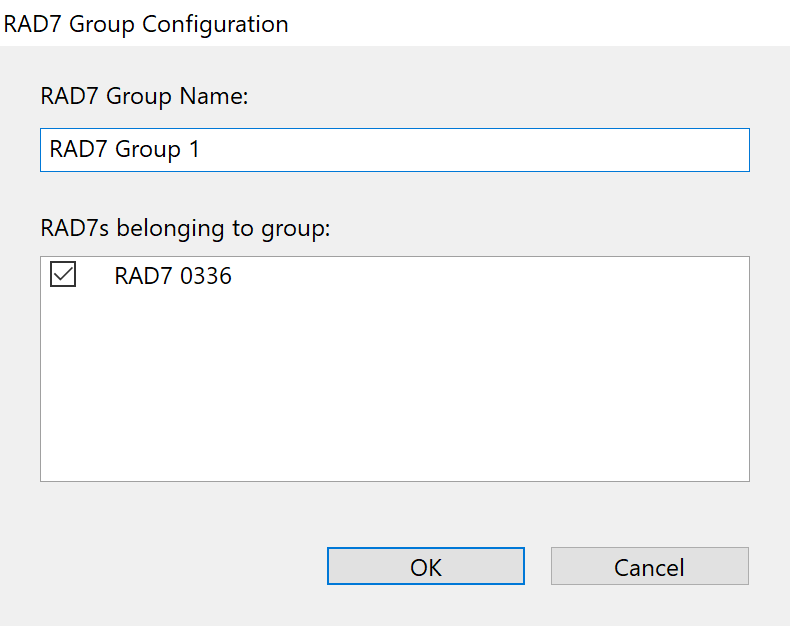 Figure 8: The Device Group Configuration Window Details on adding, managing, and removing RAD8 Groups and RAD7 Groups are provided in the Toolbar Commands section. |
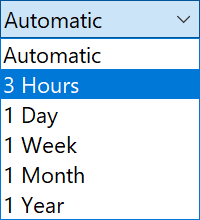
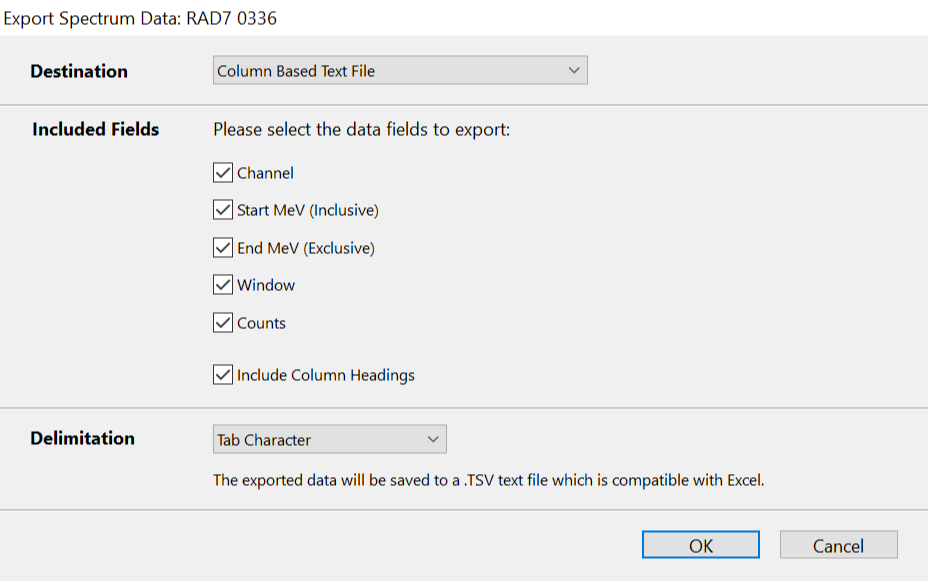
| Logging Chart Data | When the Chart Recorder is active, chart data may be logged to disk in any of several formats. Clicking the Settings button, which is accompanied by a logging indicator light to the left of the chart, brings up the Logging Settings Window, which is shown below. The Logging Settings Window contains checkboxes for specifying whether to log Chart Recorder data to a radon data file, a column-based text file, and/or Capture Cloud. When logging to a radon data file or a column-based text file, it is necessary to specify a location for the file on disk. When logging to Capture Cloud, it is necessary to specify a name for the data set that will be stored in the Cloud. Specifying a description is optional, but recommended. The Logging Frequency pop-up menu is used to control how often the data is logged. The default setting of Automatic causes data to be logged whenever the RAD8 or RAD7 records a new cycle. After specifying the desired settings, click the Start Logging button. The Logging light on the Chart Recorder will turn green to indicate that logging is active. Logged data will be updated whenever the RAD8 or RAD7 records a new data point. It is possible to return to the Logging Settings dialog at any time by clicking the Settings button. If logging is active, it may be disabled with the Stop Logging button, found at the lower left corner of the Logging Settings dialog. Note that even if logging is not specifically enabled, Capture will maintain records of raw Chart Recorder data in the Preferences folder. These files can be revealed at any time by selecting Show Chart Recorder Logs from the File Menu. |
|
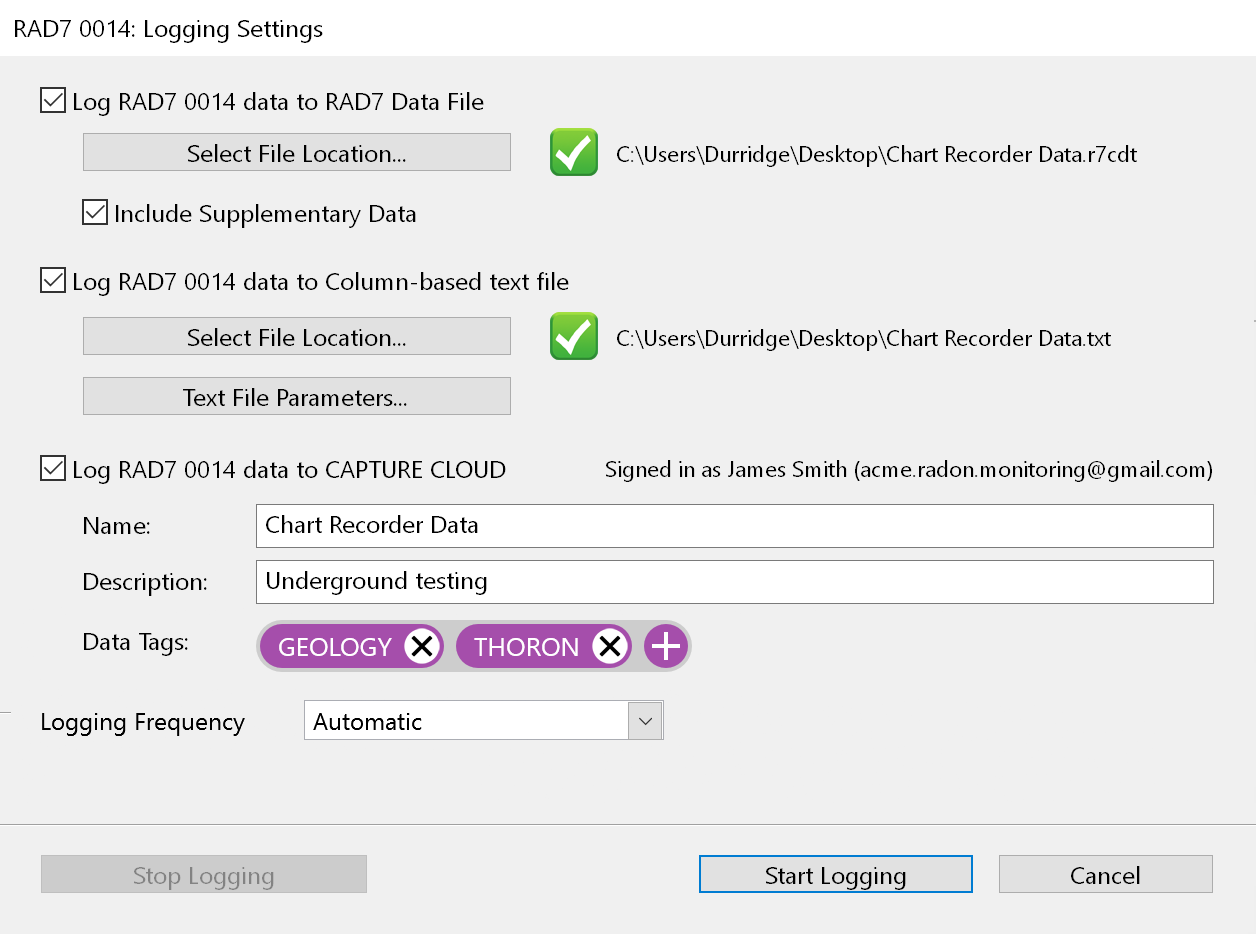 Figure 9: The Chart Recorder Logging Settings Window. |